RELEASE NOTES FOR I2G USERS

The release notes here for users who want to keep track our development stages. It helps them know what version they are using, notify new features when available. All known limitations and bug fixes can be found here for your reference.

Release Notes R1 - 2024

Version 1.01 August-2024

Enhancement Updates:
• Update API Limit logic – Fix.variable field: Only transmit FIX value for cases with assets
• Update API structure UpdateCustomerLimit: Add LimitID field in response
• Update API logic: Change data type of number fields to string
• Update API Asset logic: Add transmission of lpV6Address field data
Fix bug issues:
o API  send does not transmit amount 
o Error generating uncertain value when ending flow 
o Select File Type when Code is not selected

Version 1.10 released Sept-2024

Import and export data

Import and export well log, core data from/to popular file formats (LAS 2.0, LAS 3.0, DLIS, CSV/ASCII/TXT). Automatically detect curve family based on curve name and unit.
All well data imported in I2G can be used for different projects without uploading data again.

Import and export well log, core data from/to popular file formats (LAS 2.0, LAS 3.0, DLIS, CSV/ASCII/TXT). Automatically detect curve family based on curve name and unit.

All well data imported in I2G can be used for different projects without uploading data again.

Fix bugs

  • Import feature stop working with Excel files that contains images

Known limitations

  • CSV files with commas inside the content of fields

Version 1.11 released Oct-2024

Fix bugs

  • Import feature stop working with Excel files that contains images

Known limitations

  • CSV files with commas inside the content of fields

Version 1.5 released Nov-2024

Well data management feature available

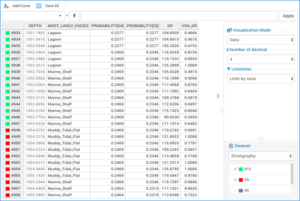
After successful imported wells in I2G, in some projects, there are maybe a lot of well and data used for work. With well data management, users can easily organize data by grouping or tagging multiple data items. When clicking on any tagging name on tag bar, a list of well with this tag will appear on project browser.
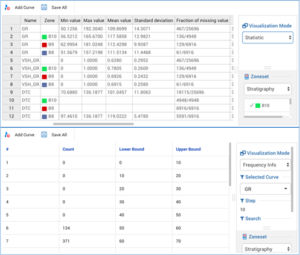
Powerful searching function with the ability to search data by name, family, well header, and unit.
Different data type (. i.e., log, core, array, text, zone, marker, image …) are represented by different icon, help users quickly recognize the data they need.


Version 1.6 released Dec-2024


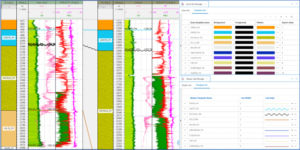
Zone and marker management

The centralized zone and marker template system allows user to make a consistent display for the same zone/marker across multi-well plots.
With zone and maker management, users can quickly create a zone template then apply it to all available well in project and easily convert zone set to marker set without create a new marker set. In addition to, the user can do:

  • Zone/marker template set
  • Create zone on multi-well log-plot with available zone template set
  • Create maker on multi-well log-plot with available marker template set


Release Notes R2 - 2025

Version 2.00 released Feb-2025

Data presentation feature now available

And user can easily show data statistic info at any zone interval.

Version 2.00 released Feb-2025

Data editor feature ready!

Users can easily transform their curves using various strong data processing tools. With Data editor, user can conveniently edit any curve value using familiar spreadsheet Excel-like editor.


Version 2.01 released 28-Feb-2025

Bug fixing only

User unable to load data if contains some special characters

Version 2.10 released Mar-2025

Visualize data statistics

User easily show data statistic info at any zone interval. Various mathematical functions to support advanced curve editing.

Version 2.11 released Mar-2025

Curve comparation
Calculate statistical relationship between two entities. in other words, it’s how two variables move in relation to one another. In some cases, users might have predicted how things will correlate, while in others, the relationship will be a surprise to users. It’s important to understand that correlation does not mean the relationship is causal.

Combine or merge curve
Resample curve in different datasets. When there are some datasets in one well with different step, users can copy data from dataset A to dataset B and software will automatically make curve resample same as step in dataset B.

Change scale of curve by using Curve rescaling

Provide a bunch of methods to make curve smoothy.

Covert MD (measure depth) TVD (True vertical depth).

Version 2.14 released 2-Apr-2025

Plot view multi-well correlation feature

Log-Plot is a useful tool that allows users to display every petrophysical type of data, including log, zone, marker, text data, array data, core image, and core measurements etc. by dragging and dropping curves in Project browser to Log-Plot window. With Log-Plot on I2G users can:

  • Fully Interactive drag & drop interface for multi-well and multi-zone plot.
  • Quickly display zone/marker stratigraphic correlation with a single click.
  • Display various data types including log, core, zone, marker, text, core image, wellbore image, acoustic waveform, rose diagram, tadpole.
  • Users can view the data over the entire depth or a specific interval.
  • Cross-plot and histogram can be shown alongside log-plot for more thorough data analysis over any depth interval.
  • Common properties (i.e., scale, color, line style …) of track/curve can be quickly updated at once via bulk-update feature.
  • Log-plot templates can be used to quickly recreate plots for other wells or data sets.
  • Innovative log plot designer feature allows log-plot templates can be created from multiple existing log plots or log tracks.

A bunch of tools such as (Zoom in/out, view well in specific range, delete, create new track etc. that supports users during work with Log-Plot.