

Overcoming COVID-19 together
To support businesses through COVID-19 and its significant impact on oil and gas industry, we’re reducing the cost of our i2G subscription plan by 50%. All existing and new i2G customers will have access to the i2G platform at this reduced price from the time of purchase. This is one-time offer only and applies to both monthly and annual subscription plan.
Online wellbore data interpretation and management platform.
Collaborate anytime, anywhere.
Users from multiple locations can work together on a single shared-project in real-time
Project Import & Export
Easily handle multiple data formats
Show more
Standard base
Curve family and metadata system
Show more
Project sharing and collaborating
Collaborating with co-workers on the same project in real time
Show more
Well data management
Easily organize messy project data items
Show more
Zone & Marker management
Create, adjust and manage zone/marker with ease
Show more
Data editor
Edit data can’t be easier
Show more
Data Processing
Provides various data processing tools to transform and QC the wells data
Show more
Plot view (Logplot)
Display any curves along the wellbore with multi-well and multi-zone support
Show more
Plot view (Crossplot)
An interactive scatter plot compares multiple measurements made at a single time or location along two or more axes
Show more
Plot view (Histogram)
An interactive graphical display of statistical information to show frequency distributions
Show more
Workflow and Task (Interpretation task)
Powerful interpretation tool to calculate output curves from input curves
Show more
Workflow and Task (Interpretation workflow)
Flexible interpretation workflow with unlimited capabilities
Show more
Petrophysics package:
CRP ( Clastic Reservoir Petrophysics)
Complete suite for clastic reservoir interpretation
Show more
Petrophysics package
FRP ( Fractured Reservoir Petrophysics)
Complete suite for fractured reservoir interpretation
Show more
Reservoir package (FPA)
Quickly analyze formation pressure in single and multi-well to determine fluid contacts
Show more
Reservoir package (HFU)
Identify hydraulic flow units (HFU) by using rock quality index (RQI) and flow unit indicator (FZI) technique
Show more
Reservoir package (SHM)
A complete workflow to calculate water saturation
Show more
Project database
Store and manage all your flat files (excel sheet, doc, pdf, images…) in a unified online platform
Show more
Well Insight
Import & export
Import and export well log, core data from/to popular file formats (LAS 2.0, LAS 3.0, DLIS, CSV/ASCII/TXT).
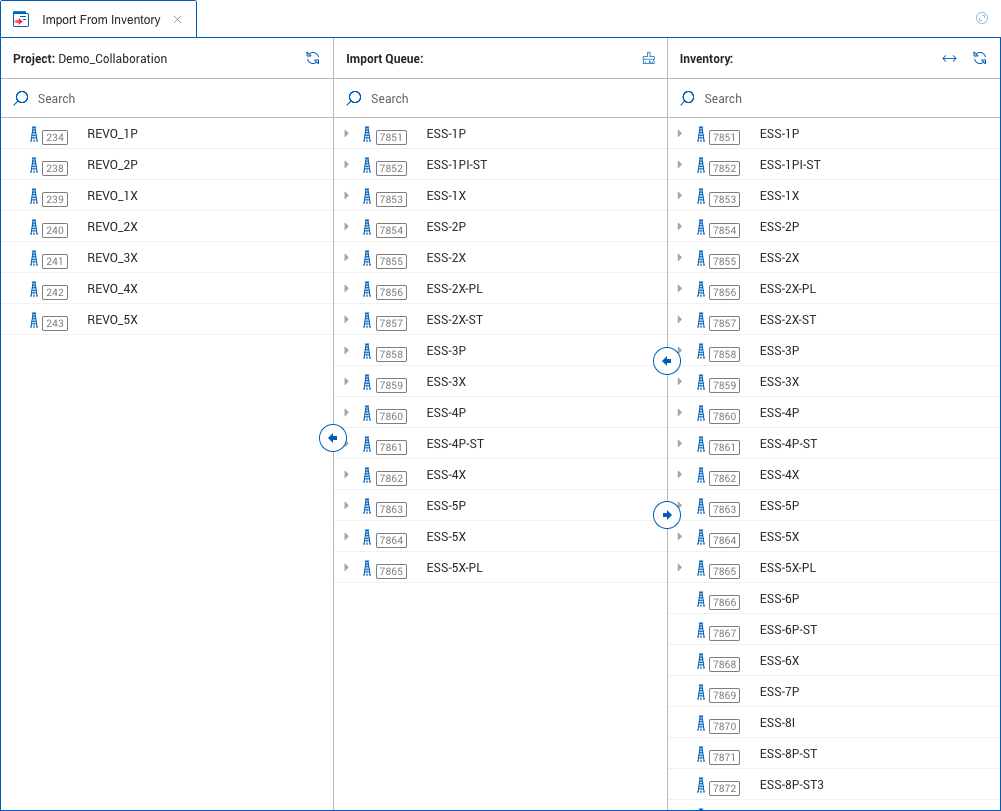
Handle image files (JPG, PNG), image log (FMI,…) or waveform data (NMR, …).
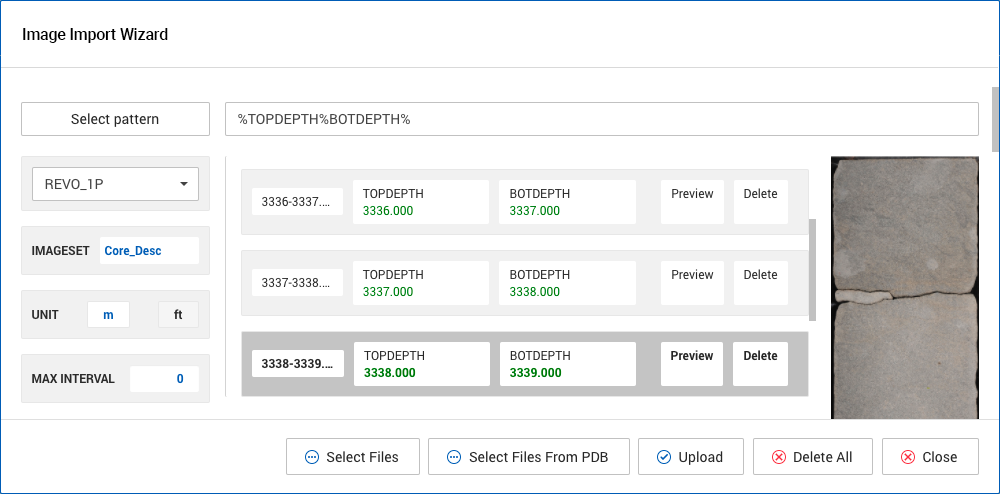
Import/export zone, marker from/to CSV file to save time.
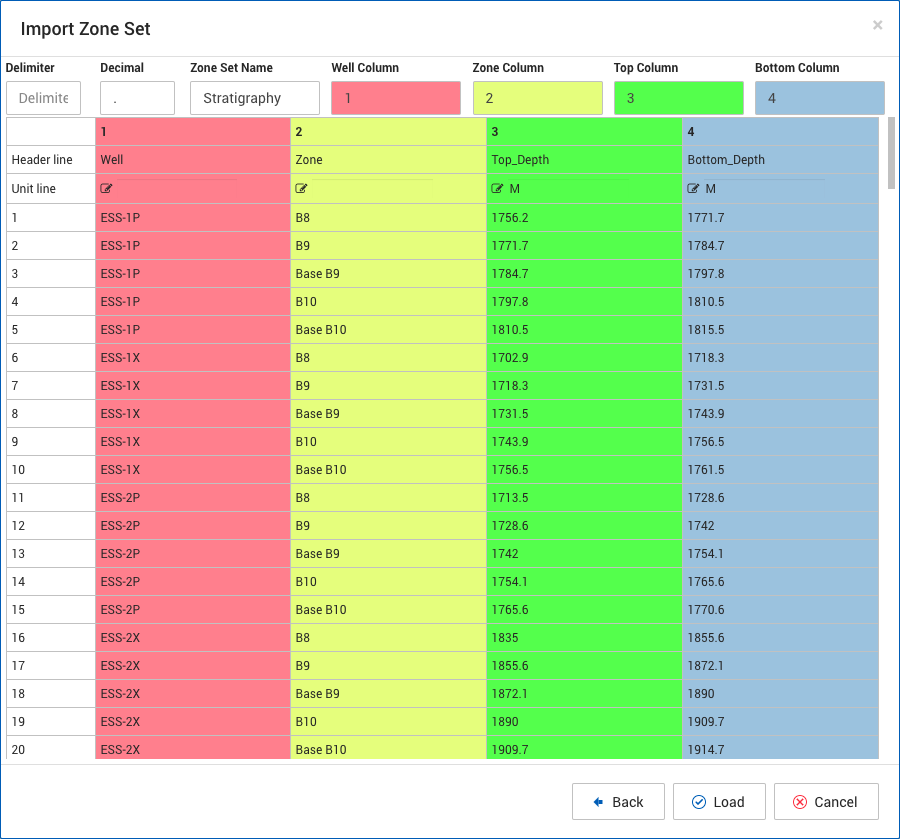
Import/export well header information from/to CSV file.
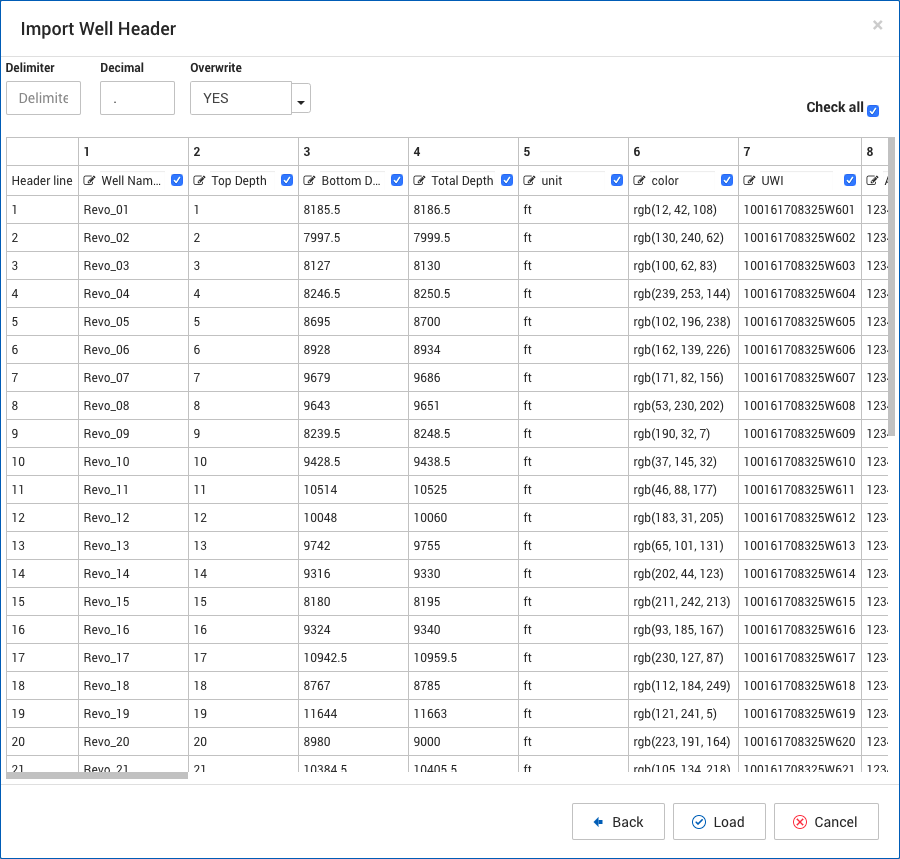
Automatically detect curve family based on curve name and unit.
Well Insight
Standard base
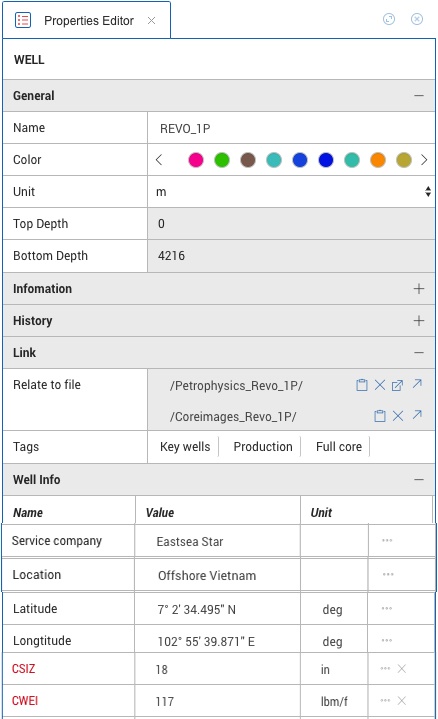
Quickly and consistently display any curve using its default family display properties (.i.e., scale, unit, and color).
Beside various predefined metadatas, users can add unlimited custom metadata to any data items (.i.e. well, dataset, curve, zone, marker, image…).
Screenshot:
Well Insight
Project sharing and collaborating
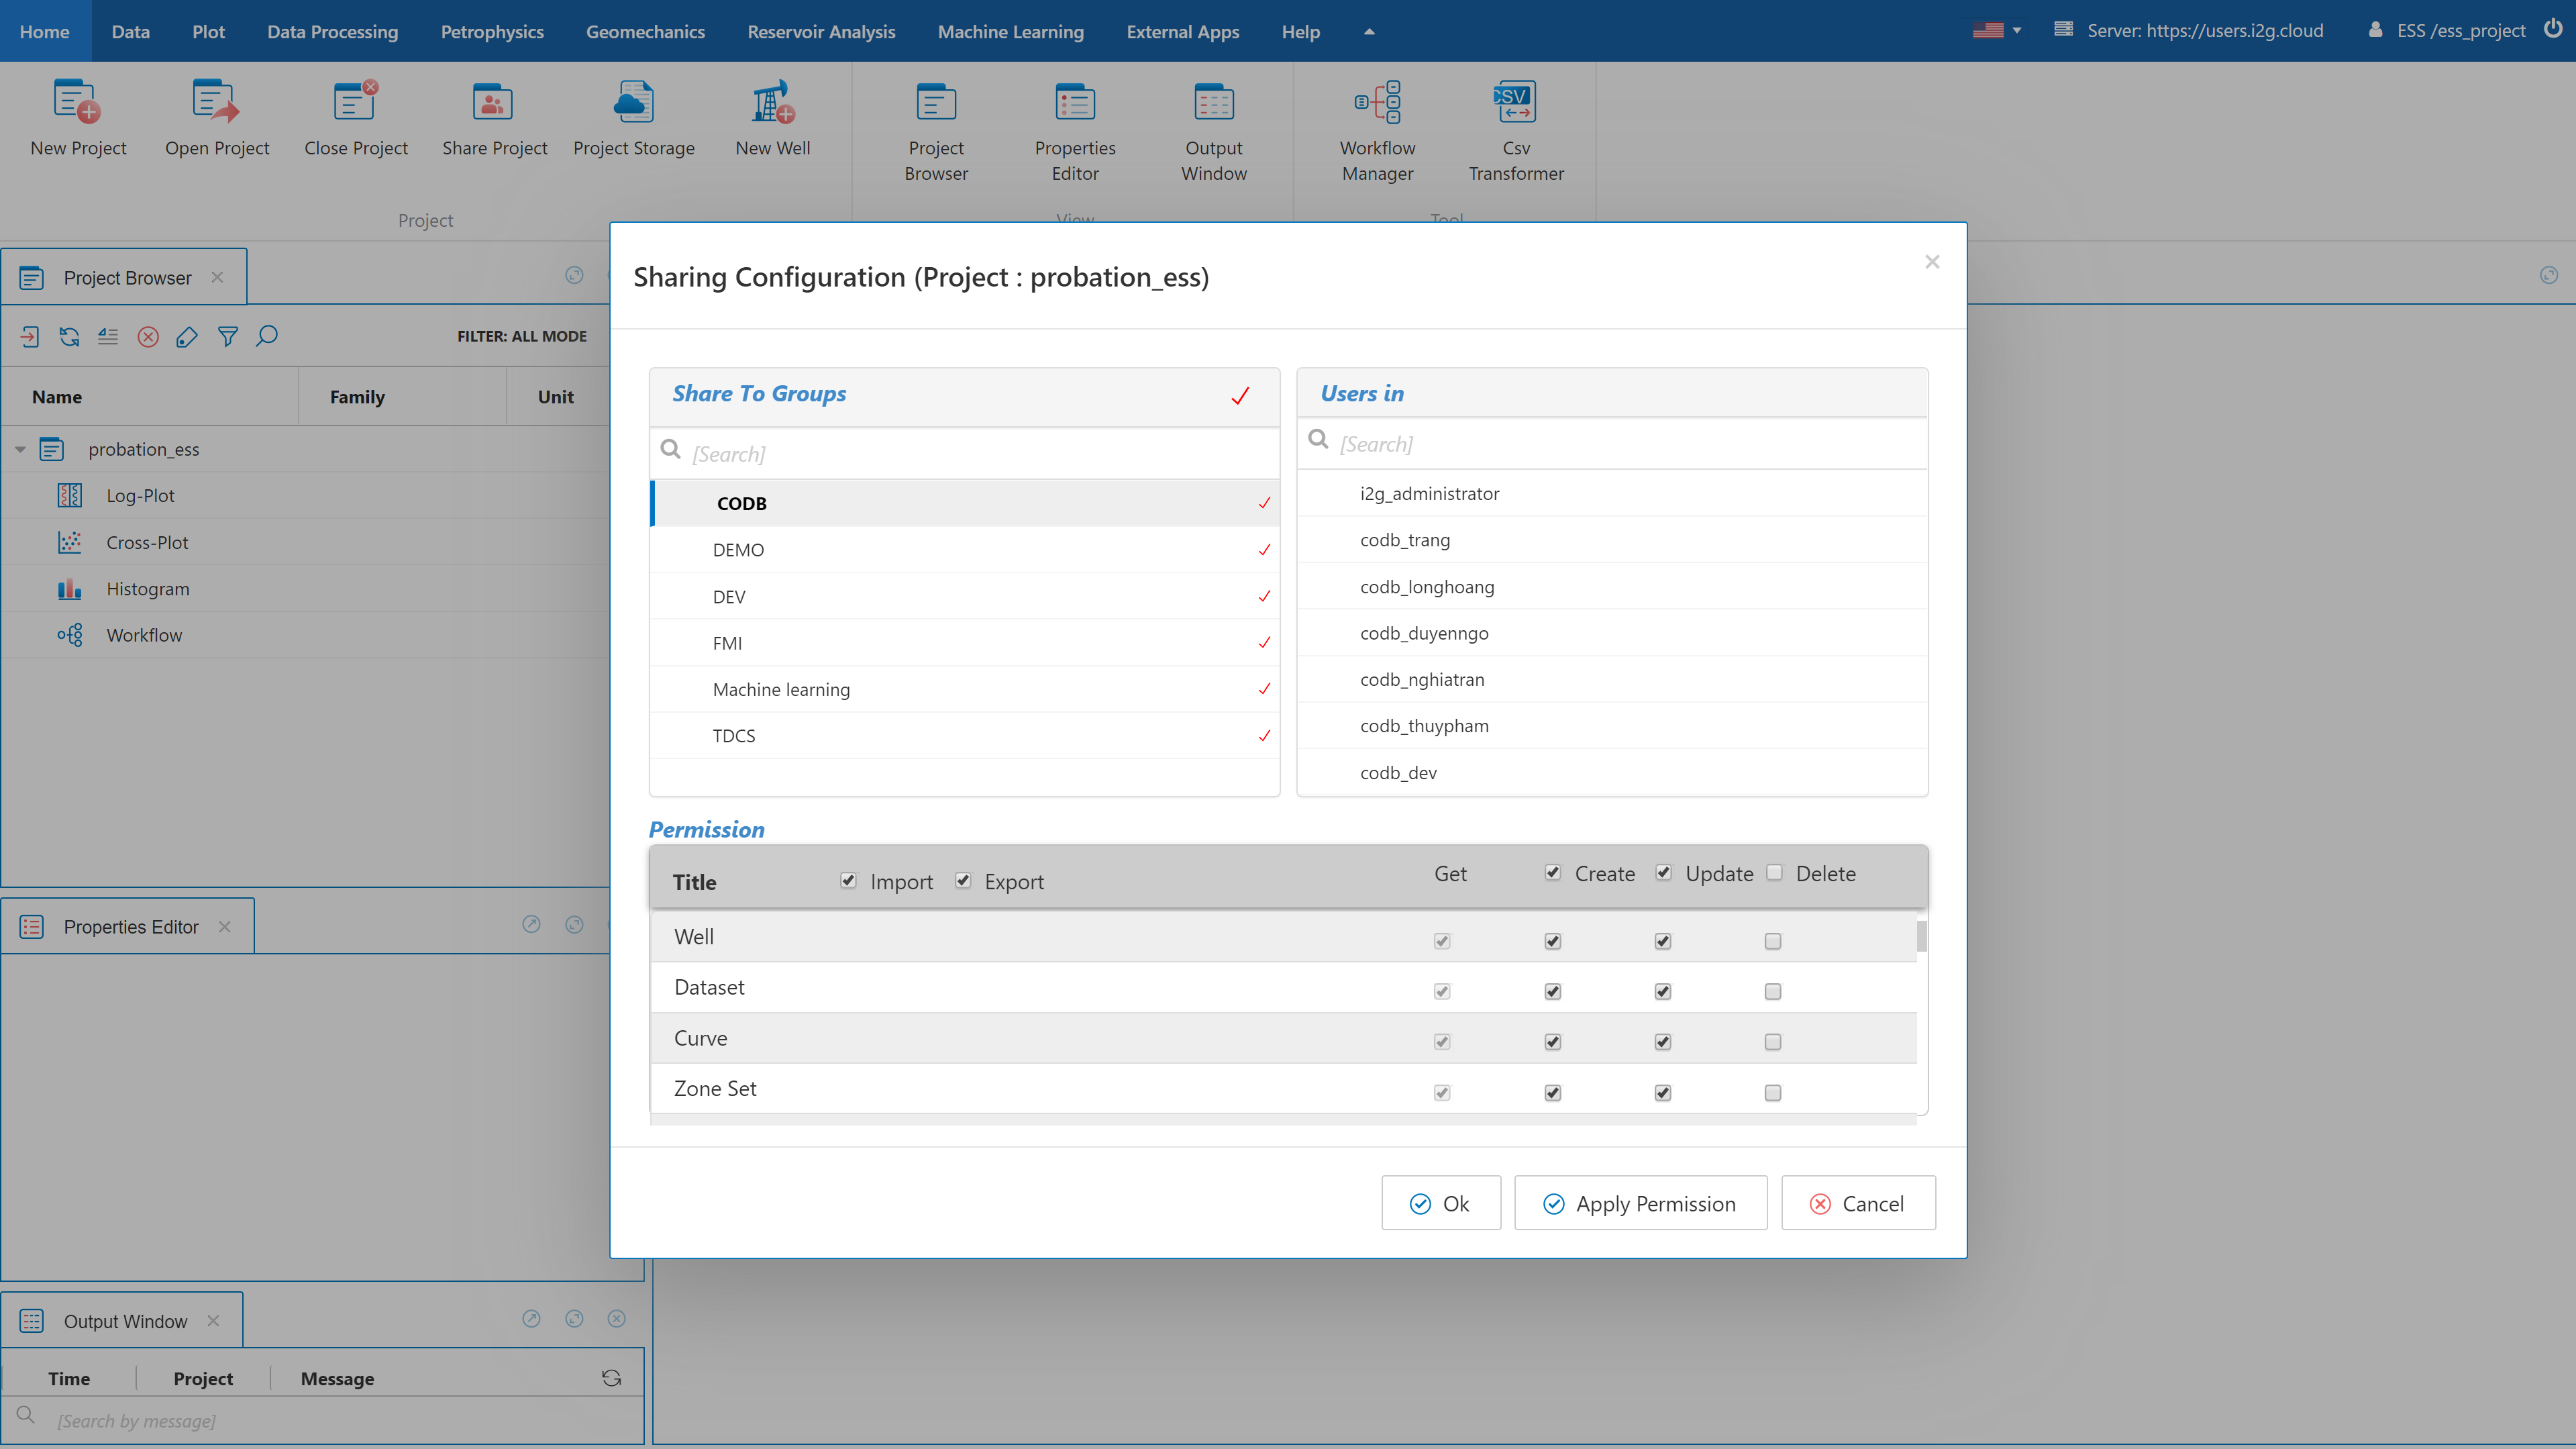
Sharing
Project sharing with strong access permission control save significant of time when multiple users working on the same project
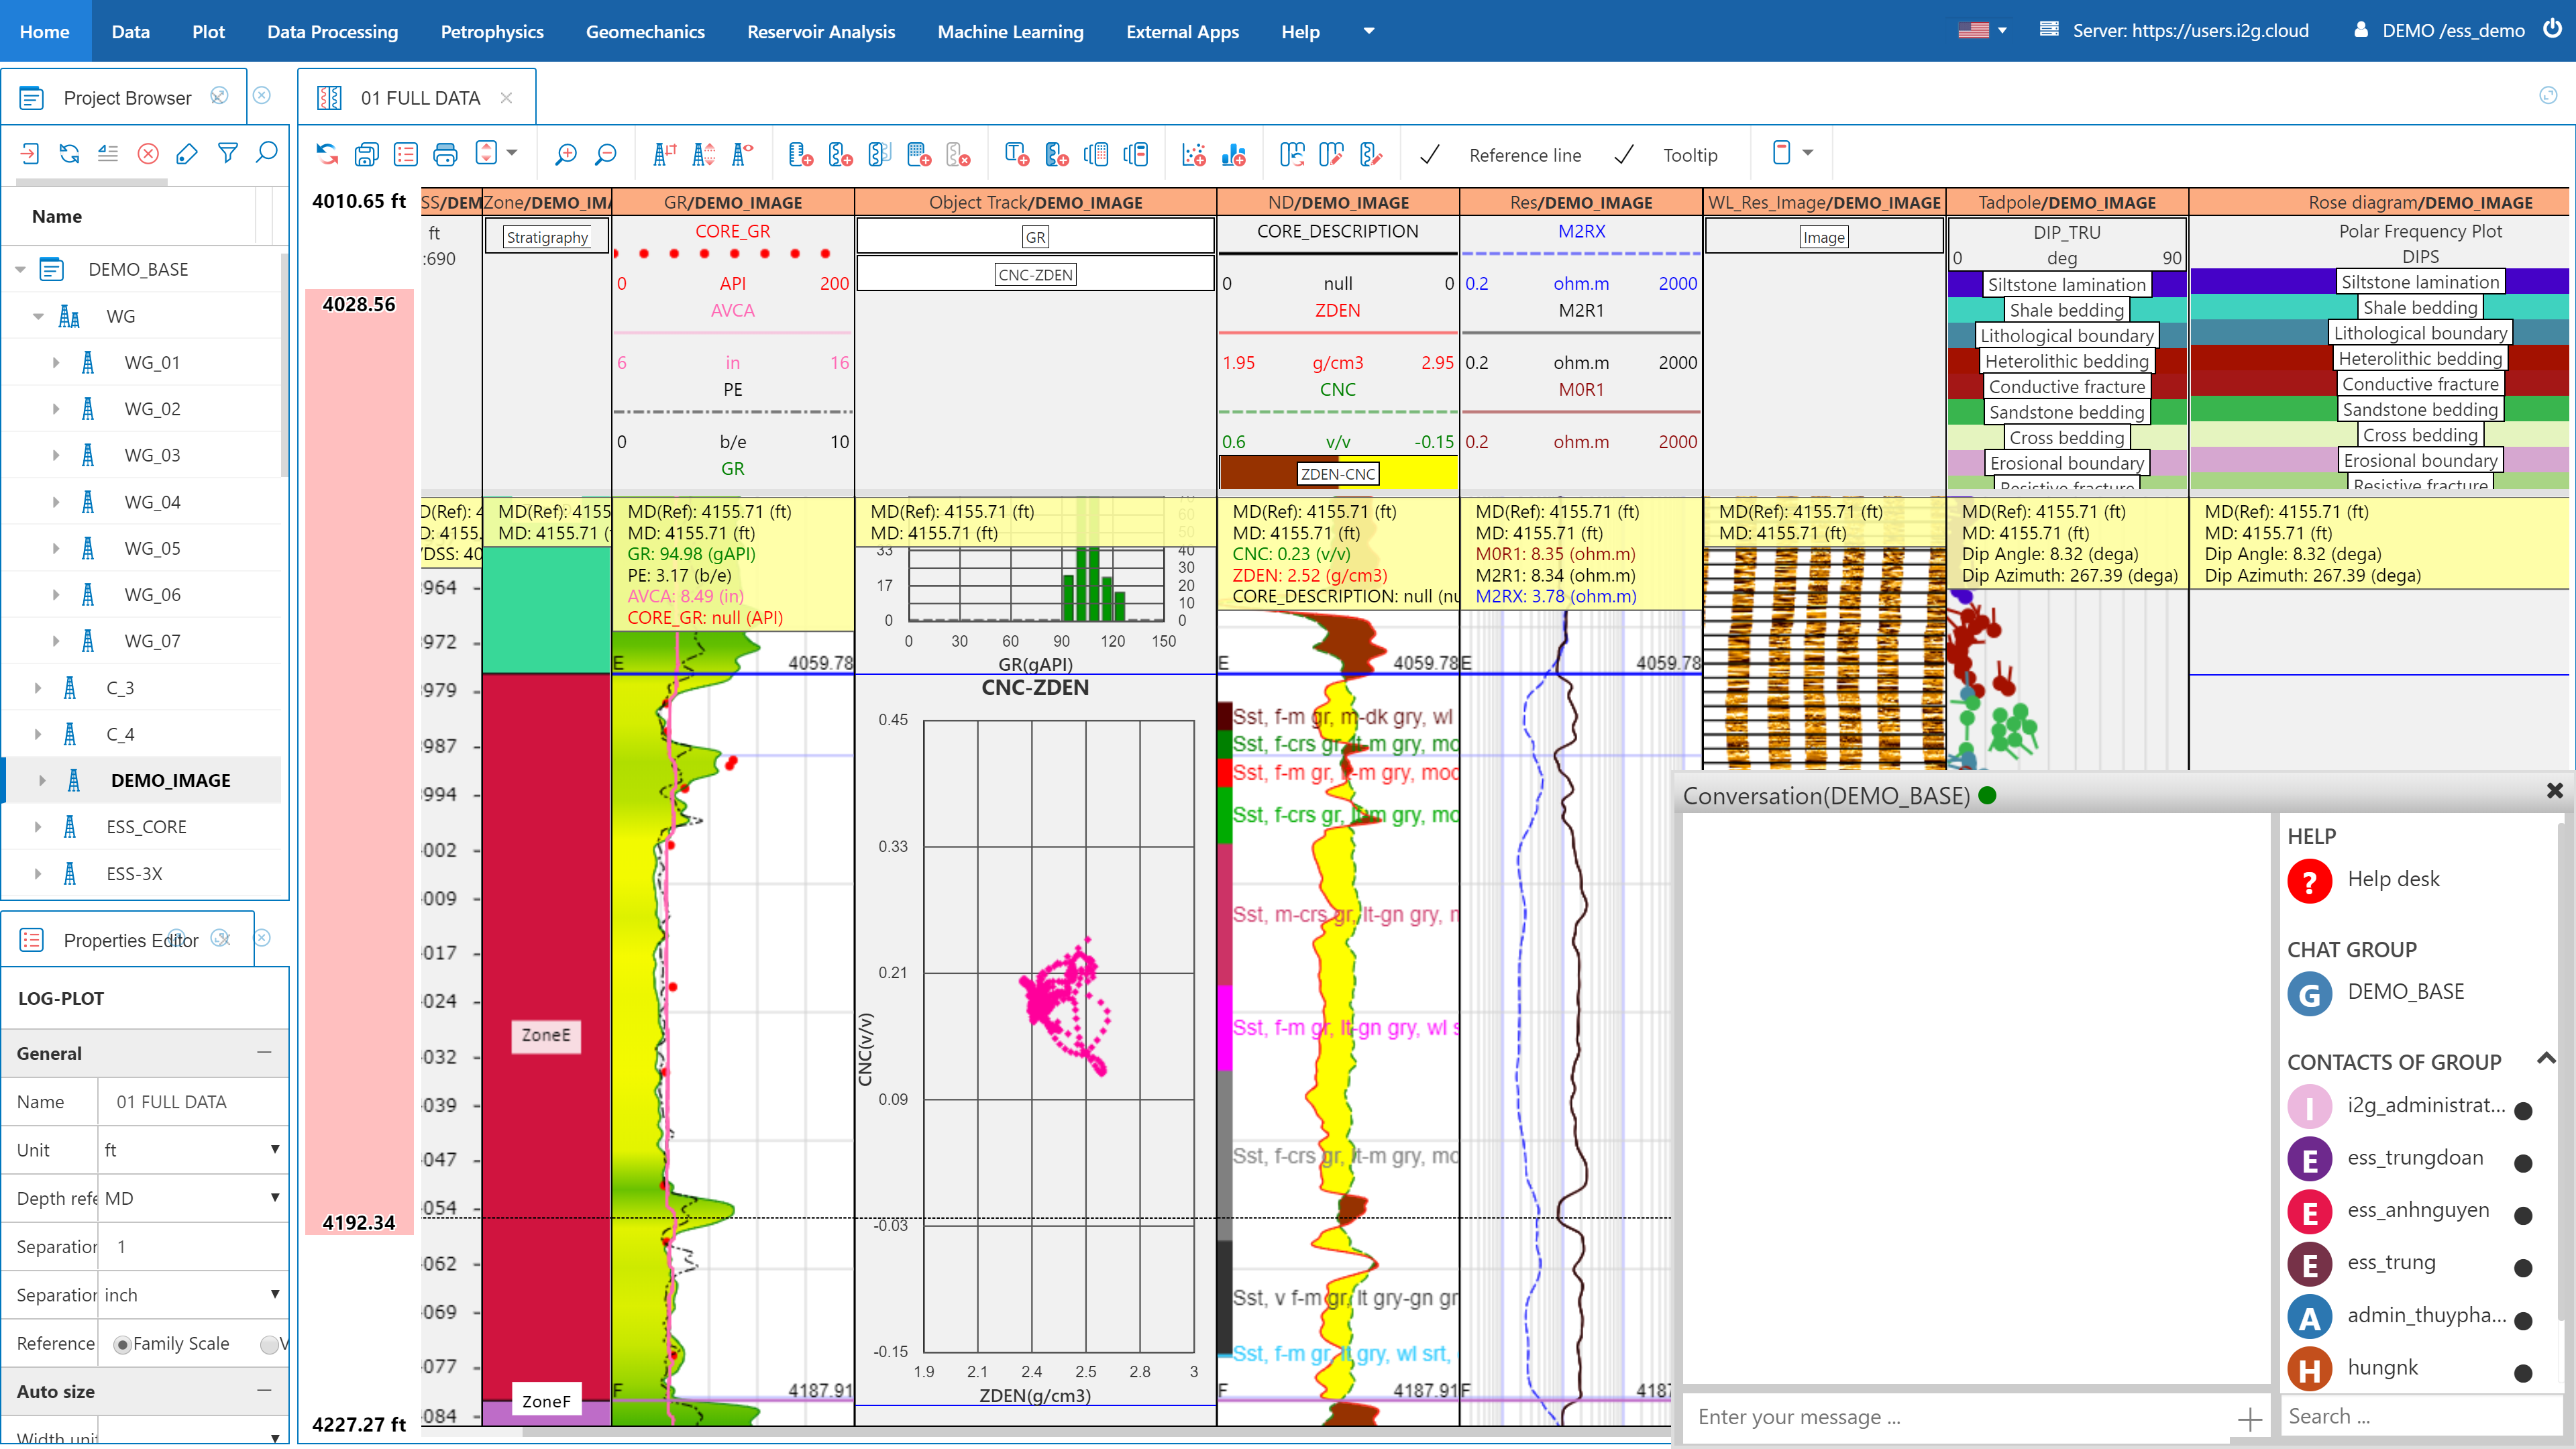
Multi location
Web-based nature allows users work from anywhere, anytime.
Group chat
Build-in chat box allows users discussing project issues conveniently.
Well Insight
Well data management
Users can easily organize data by grouping or tagging multiple data items.
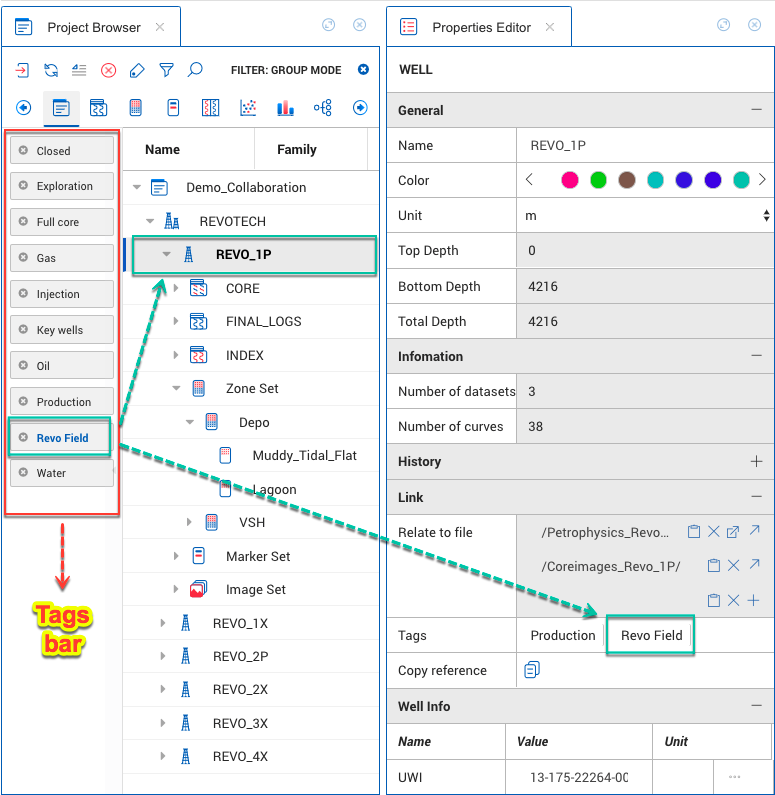
Powerful searching function with the ability to search data by name, family, well header, and unit.
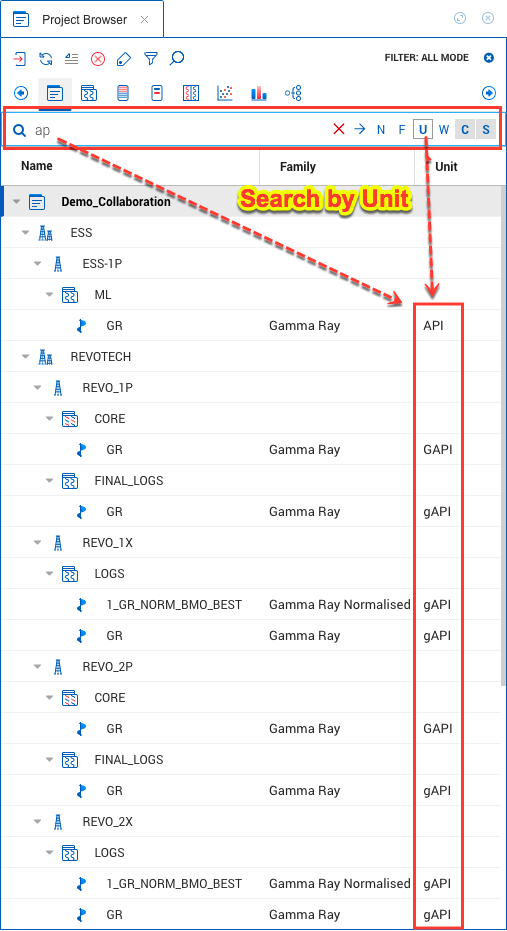
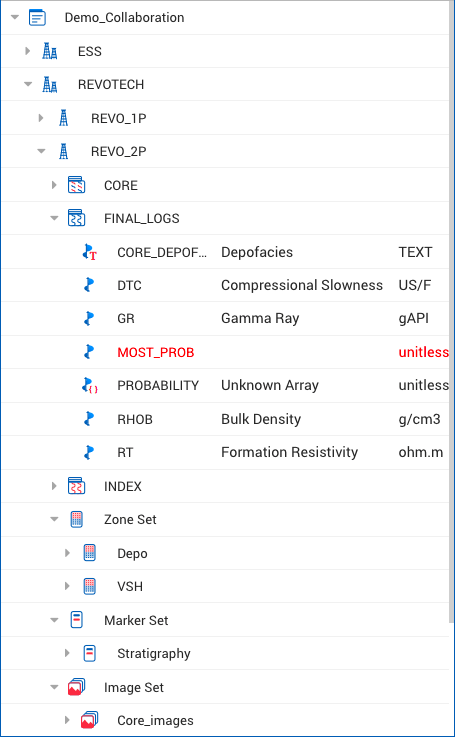
Different data type (.i.e., log, core, array, text, zone, marker, image …) are represented by different icon, help users quickly recognize the data they need.
Well Insight
Zone and Marker management
The centralized zone and marker template system allows user to make a consistent display for the same zone/marker across multi-well plots.
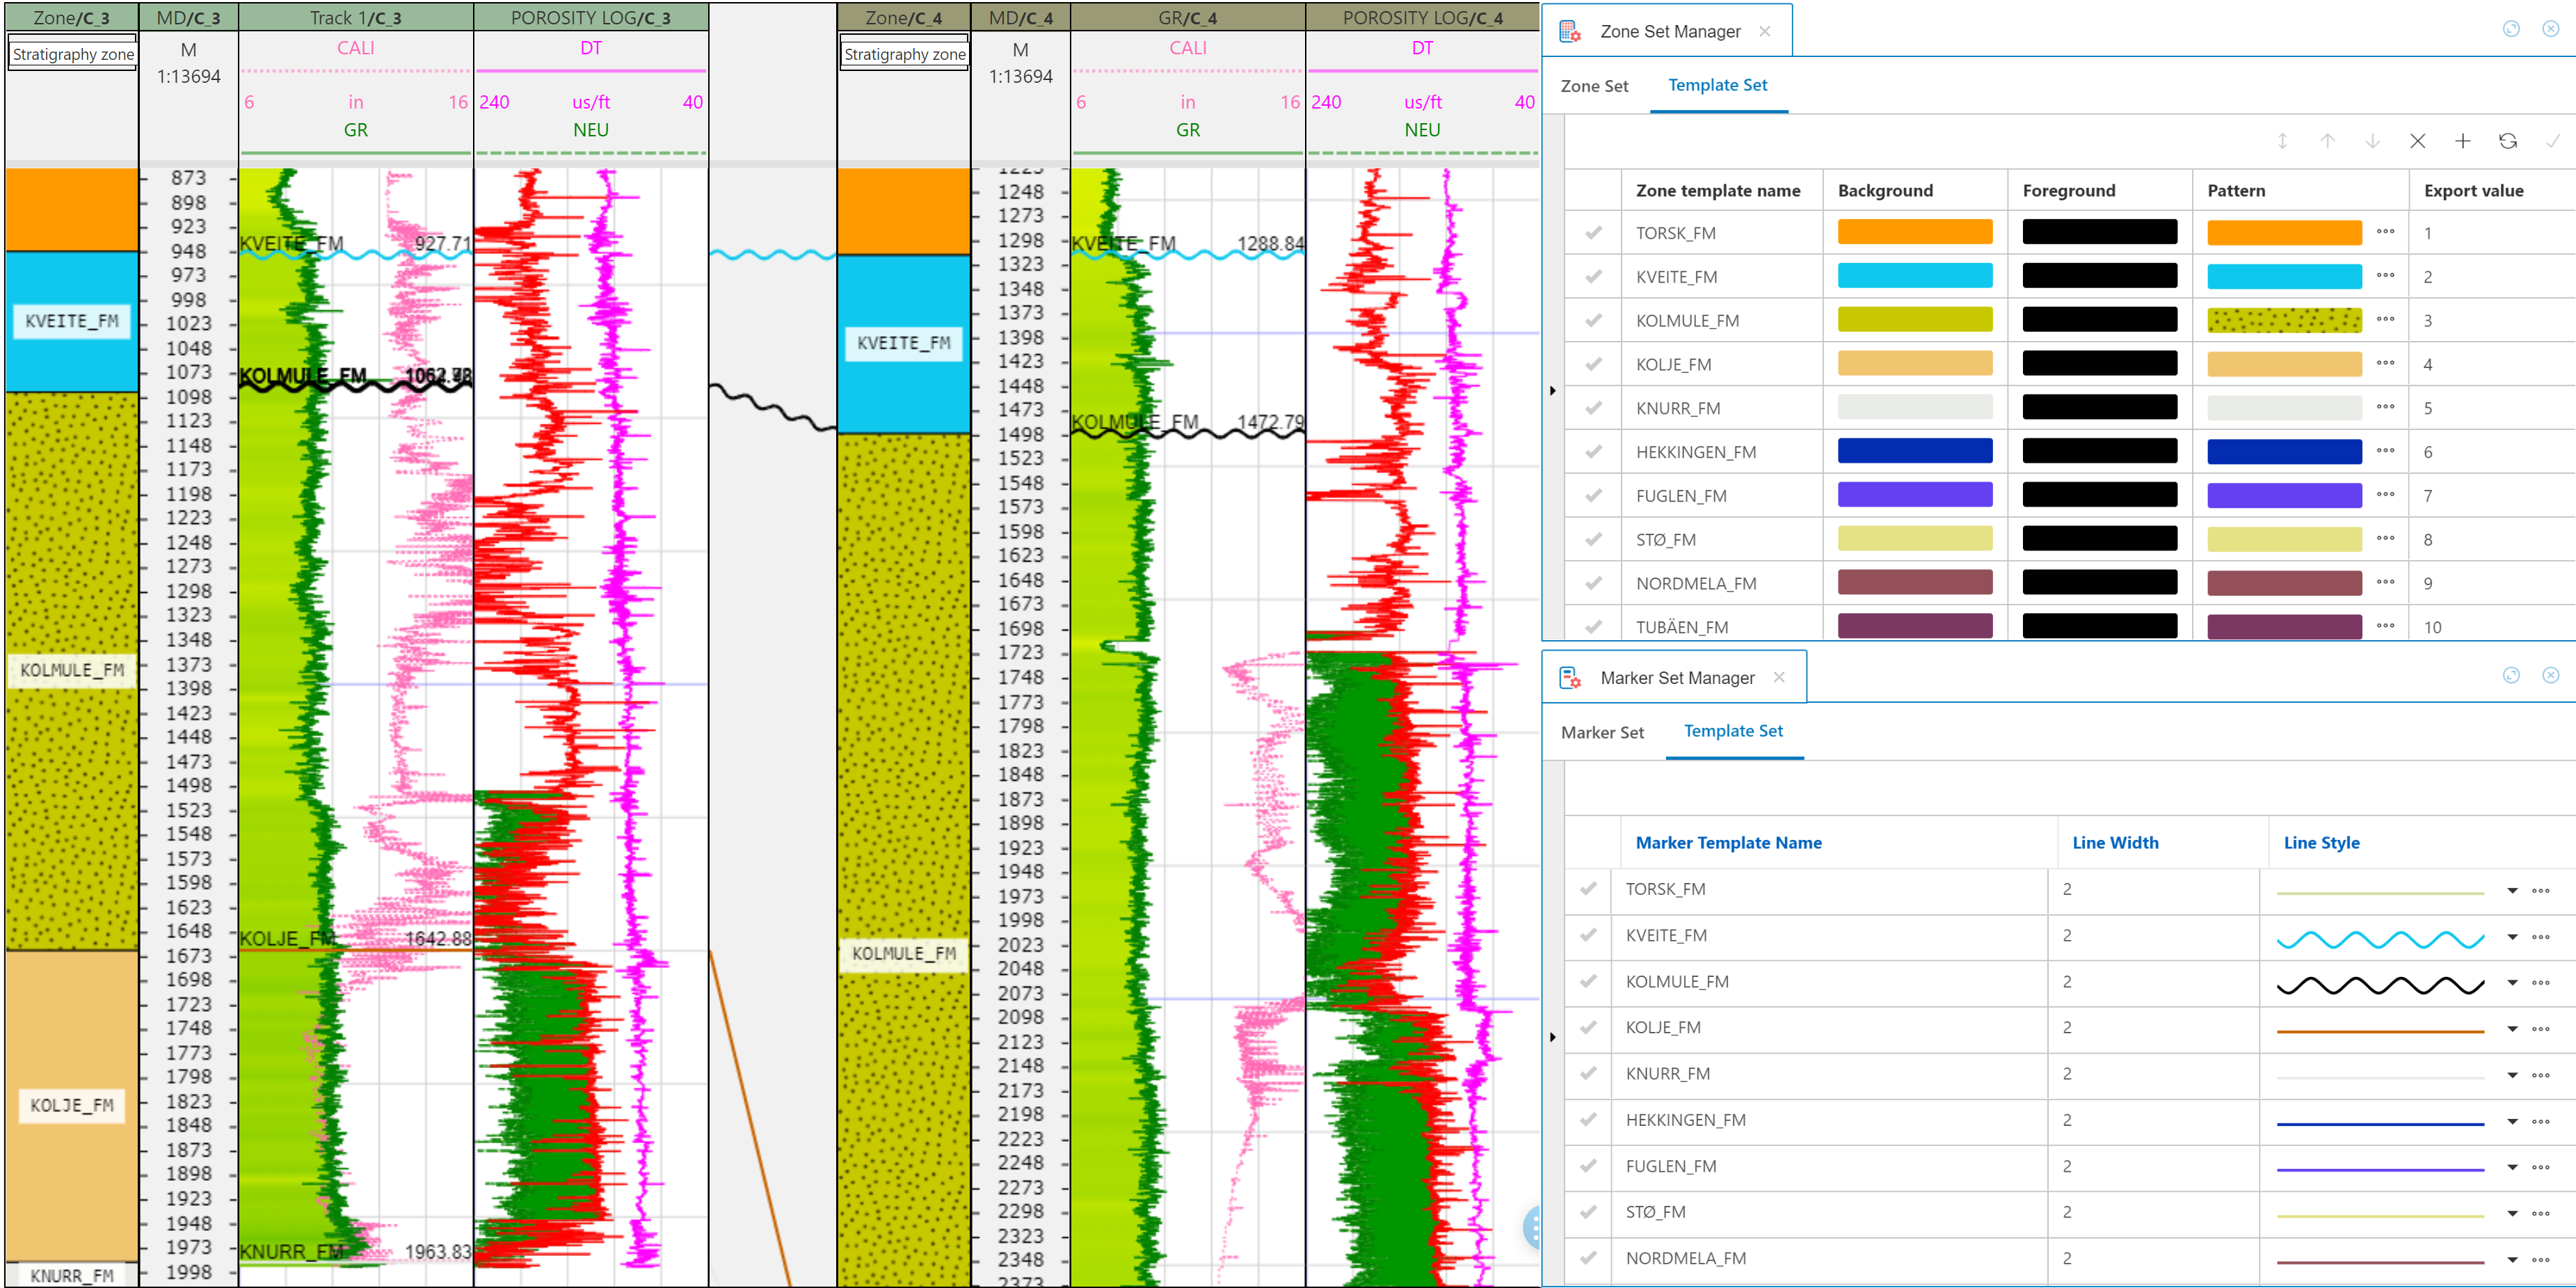
A smart UX enables users to reassign zone and marker to other types (facies, electro litho,…) in a convenient way.
Powerful converting capabilities
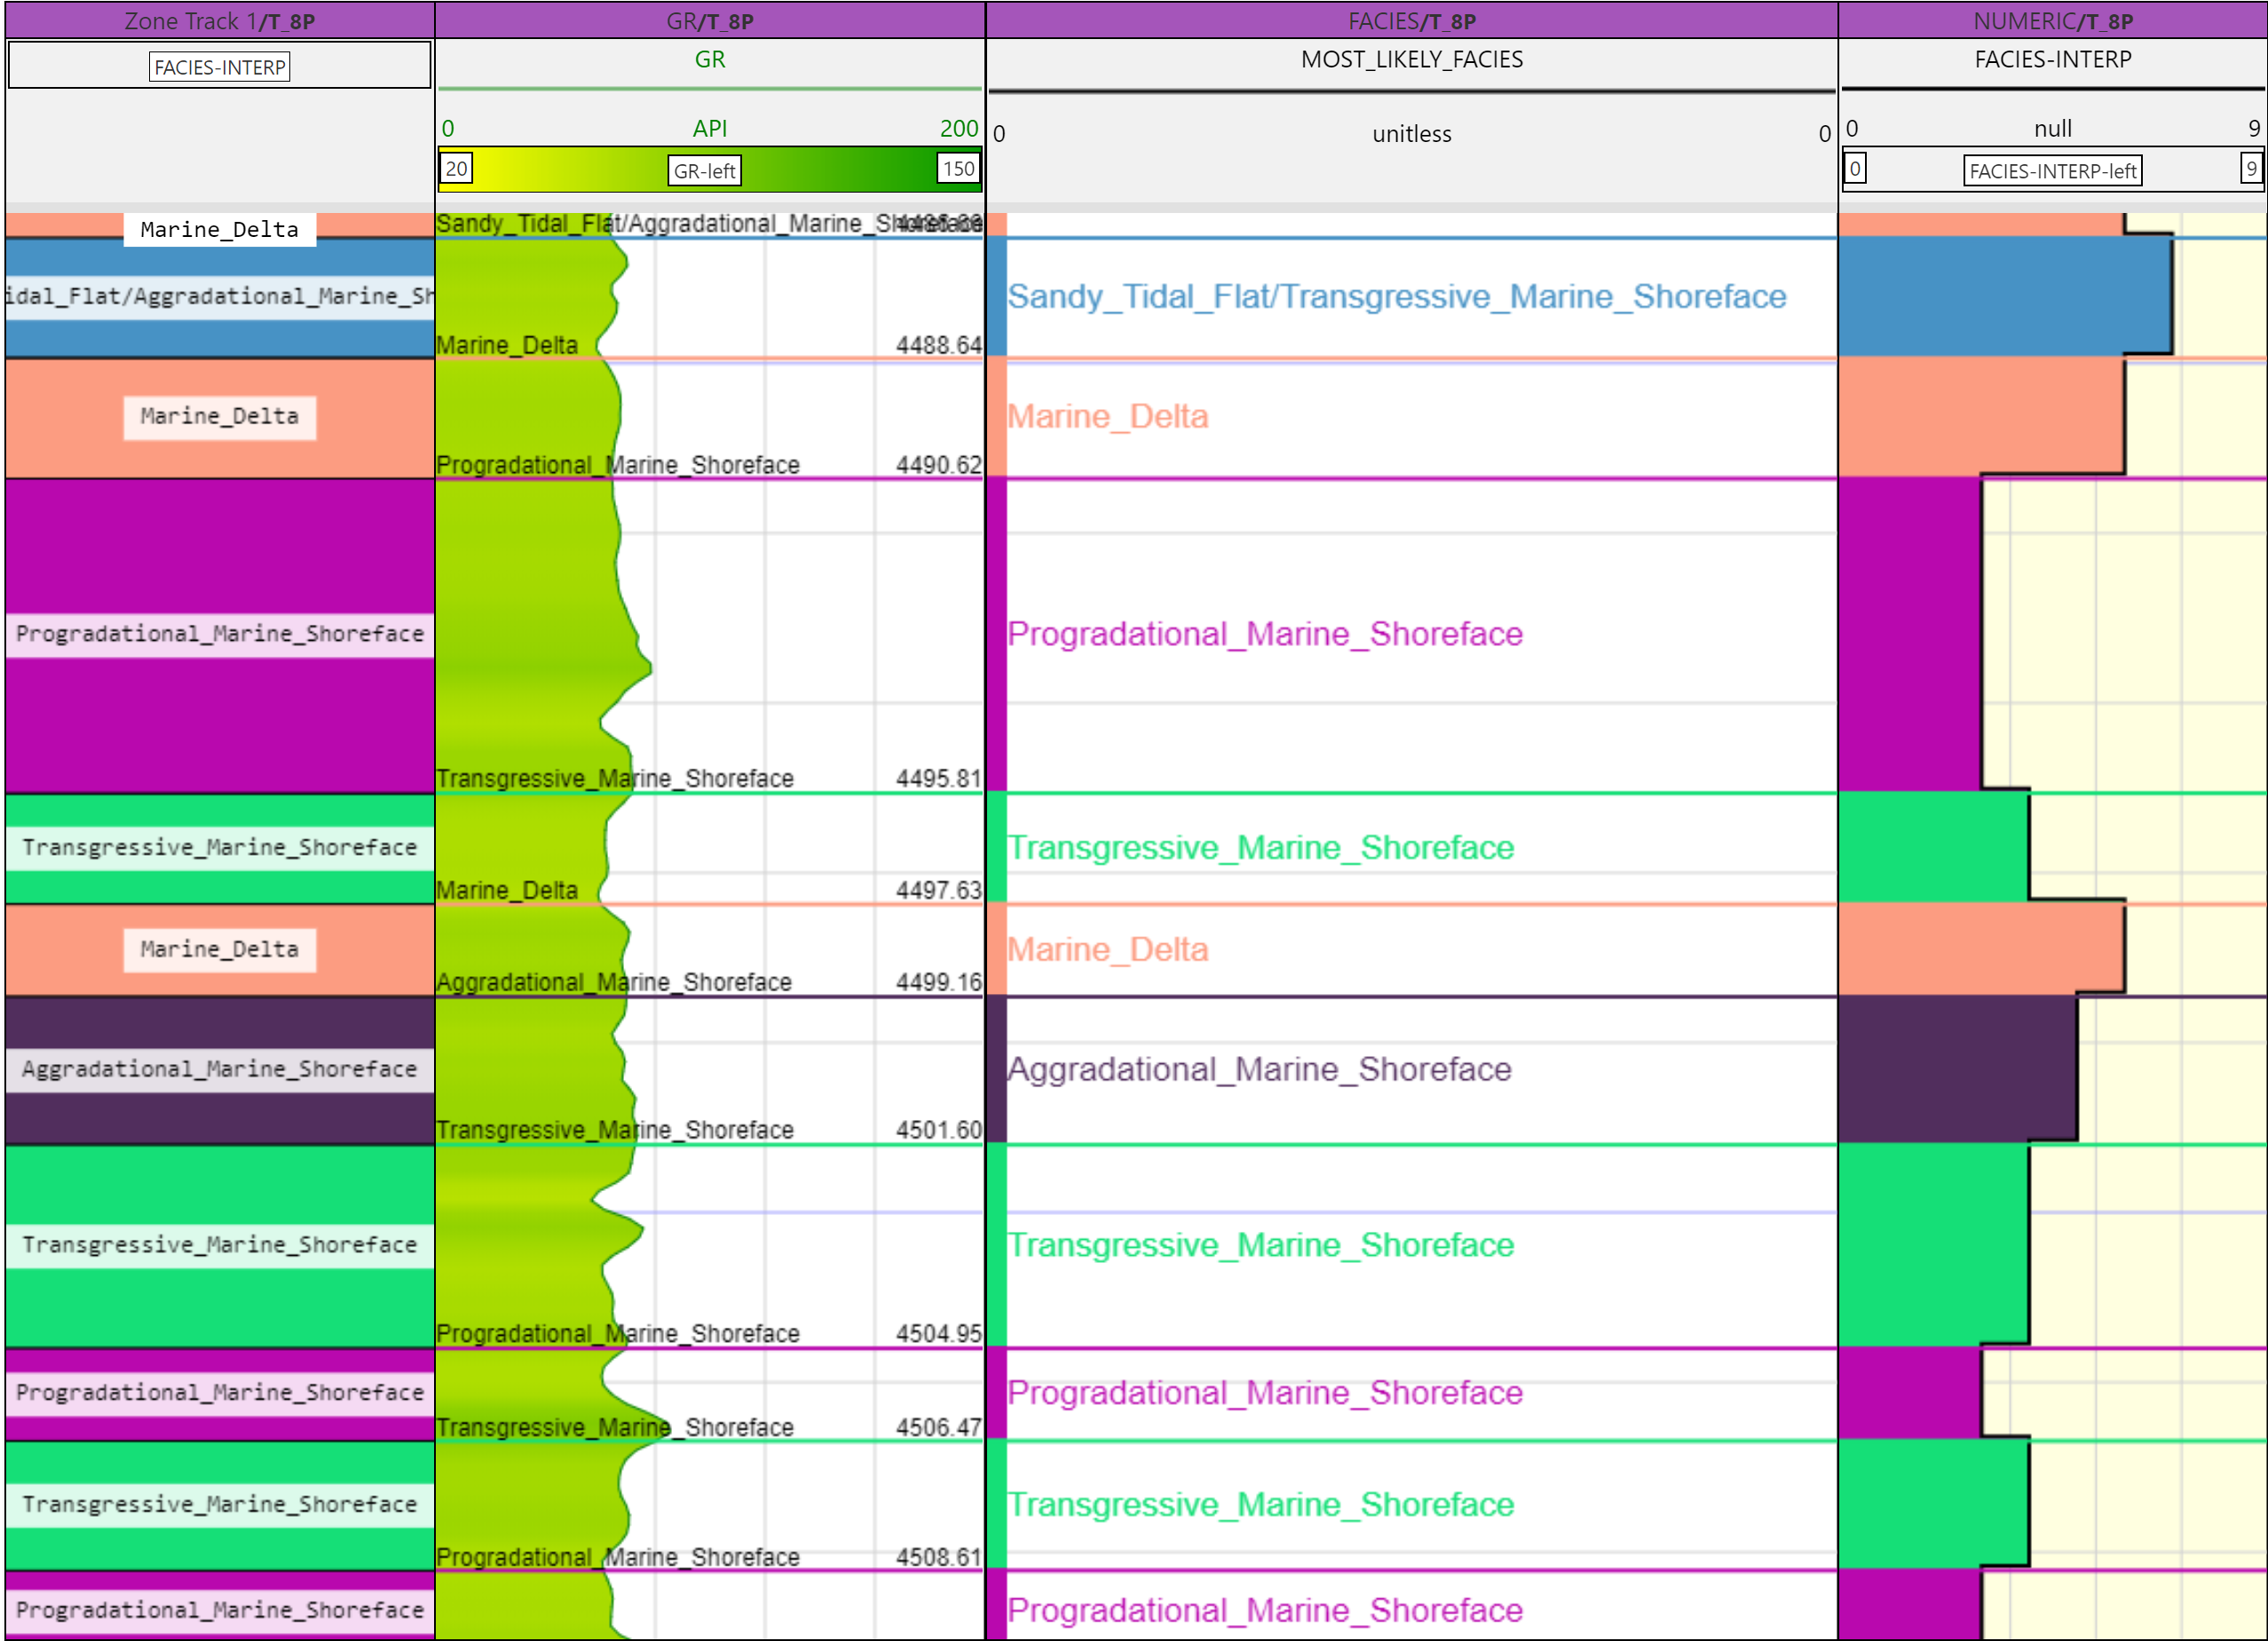
Powerful converting capabilities which allow users easily convert zone to log, log to zone, marker to log, log to marker, zone to marker, and marker to zone.
Well Insight
Data editor
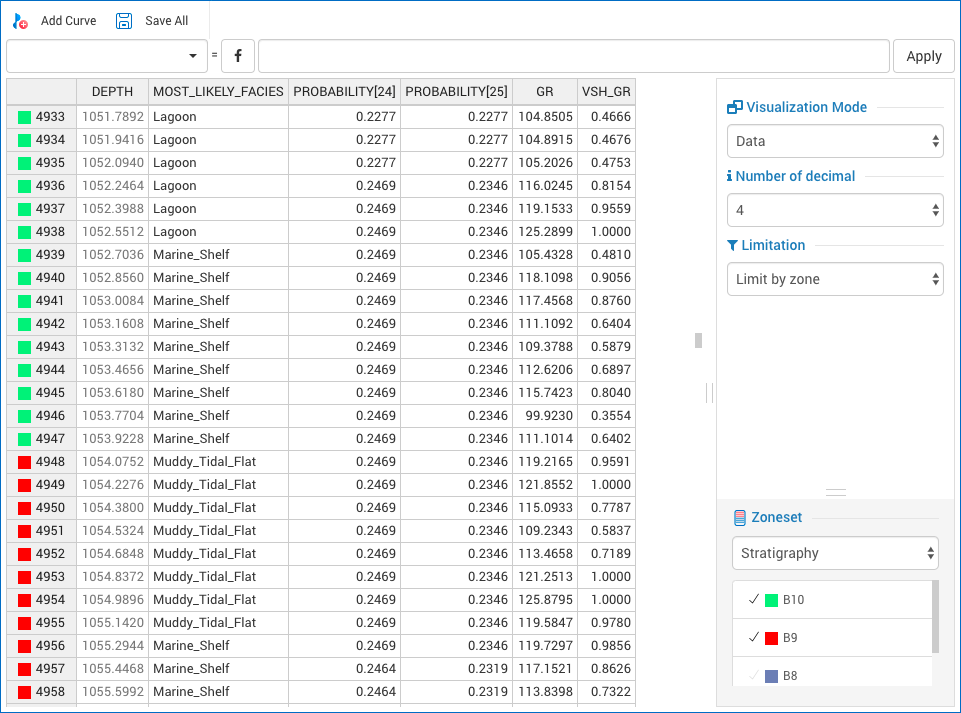
Conveniently edit any curve value using familiar spreadsheet Excel-like editor.
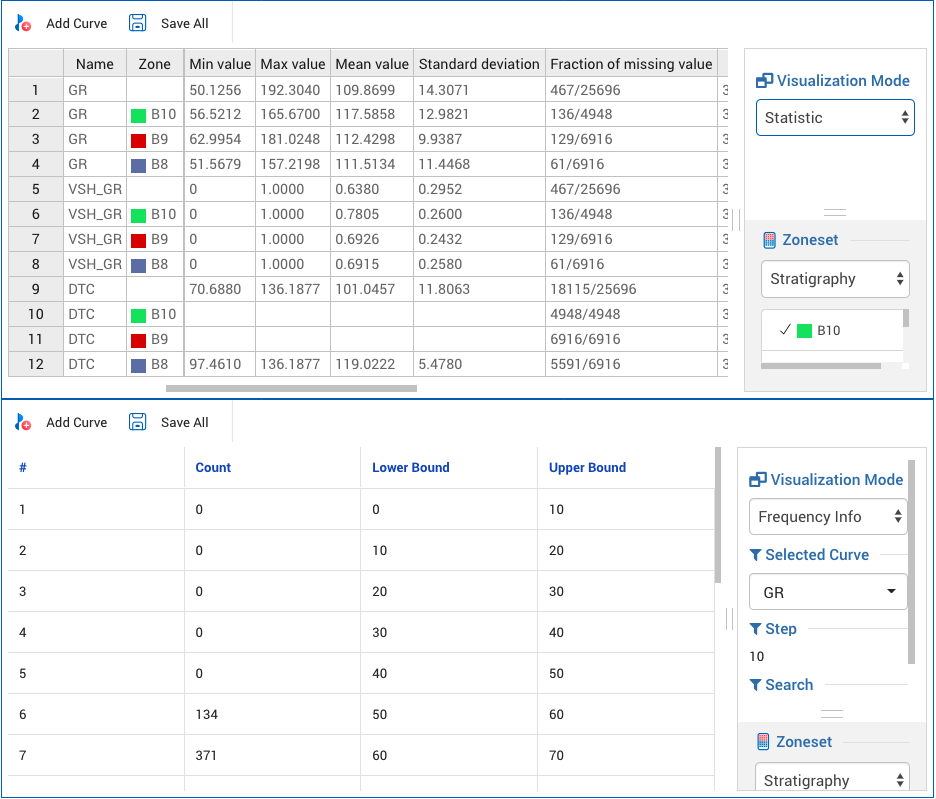
Easily show data statistic info at any depth interval.
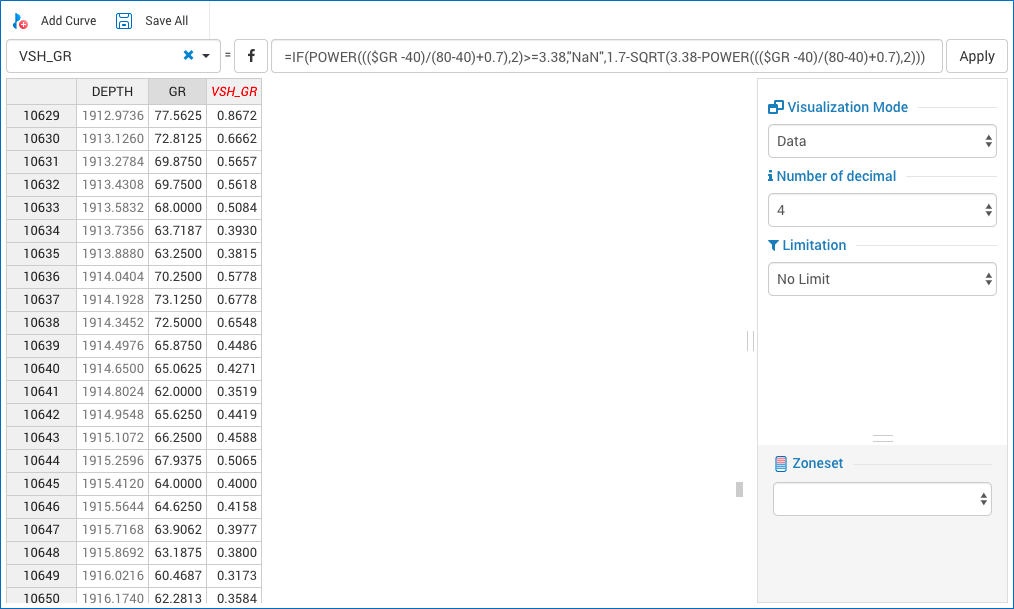
Various mathematical functions to support advanced curve editing.
Well Insight
Data Processing
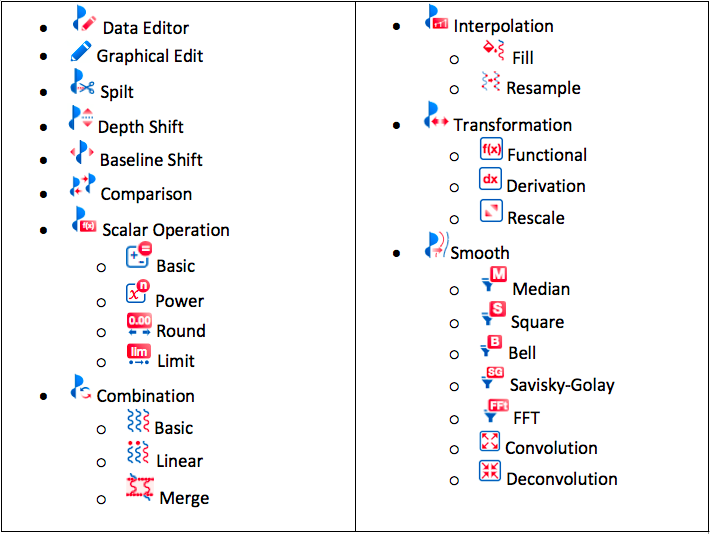
Users can easily transform their curves using various strong data processing tools.
Well Insight
Plot View (Log-plot)
Fully Interactive drag & drop interface for multi-well and multi-zone plot.
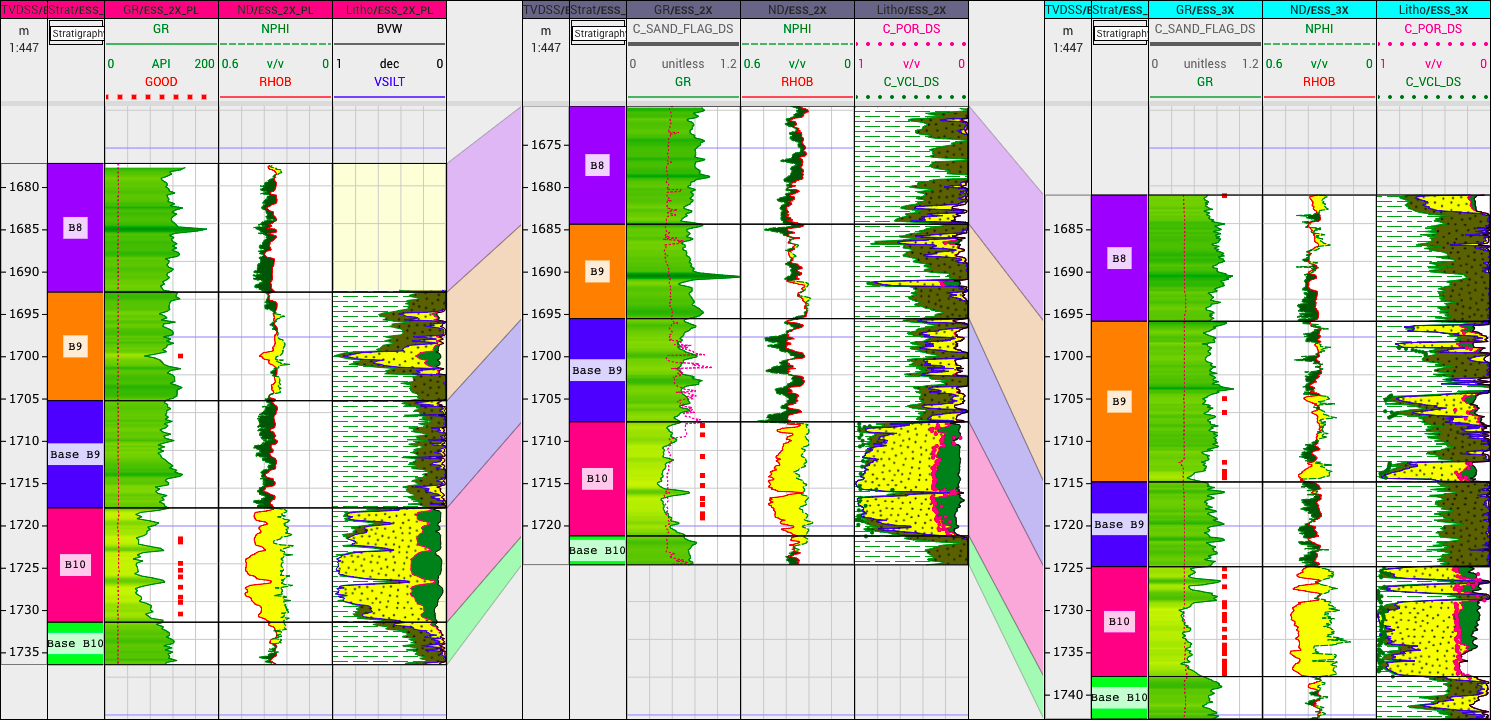
Quickly display zone/marker stratigraphic correlation with a single click.
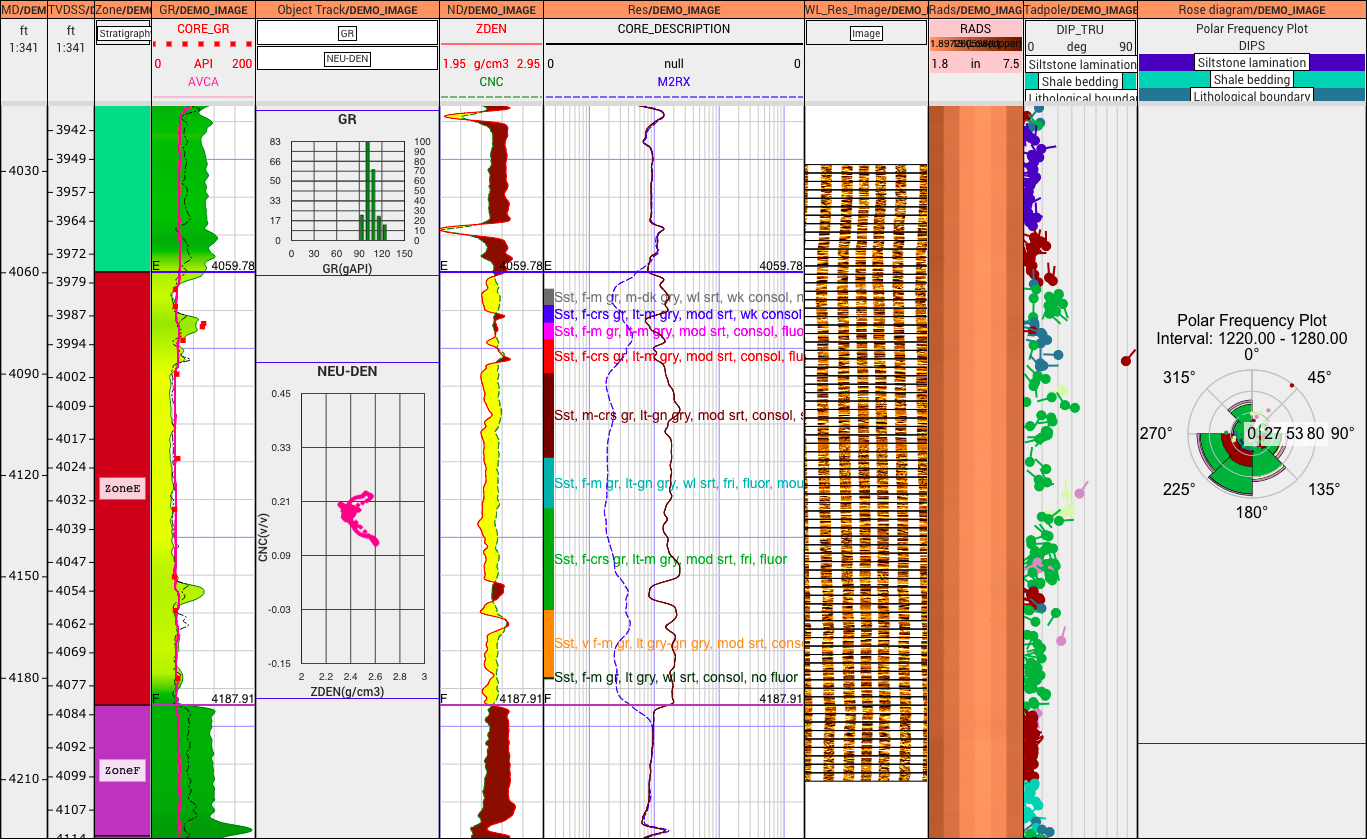
Display various data types including log, core, zone, marker, text, core image, wellbore image, acoustic waveform, rose diagram, tadpole.
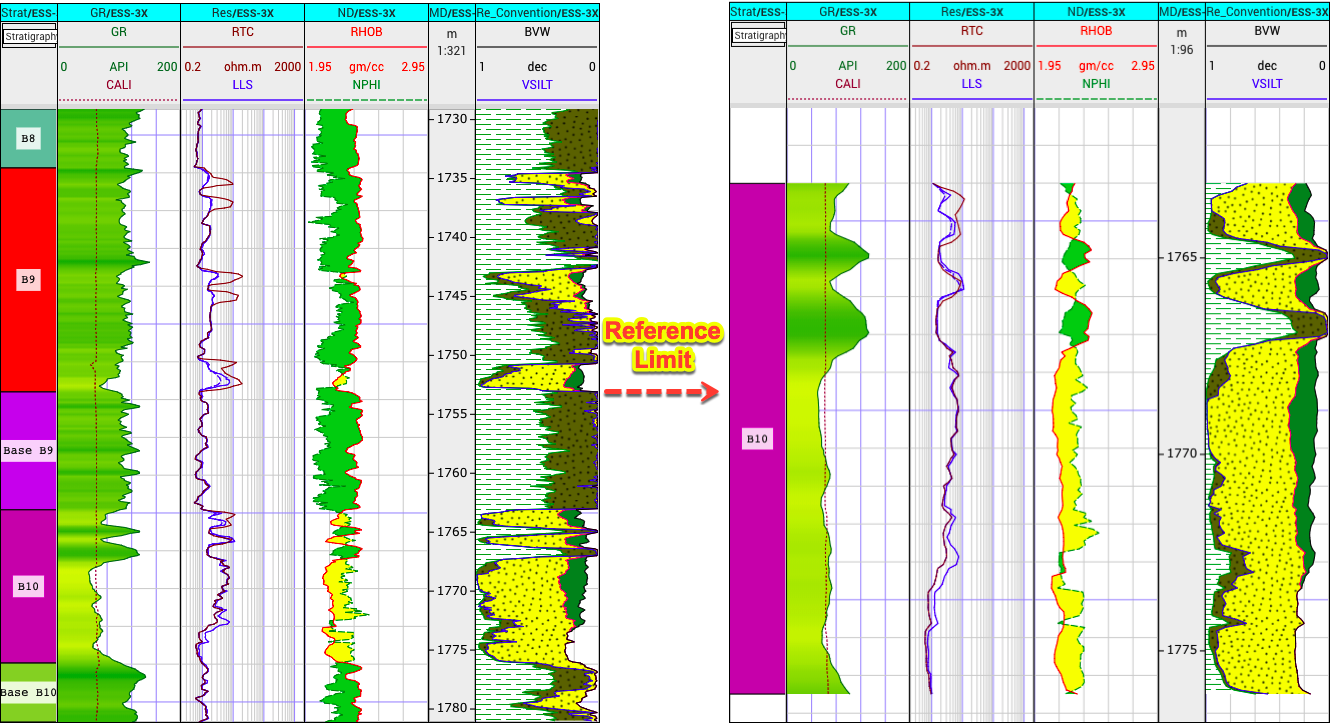
Users can view the data over the entire depth or a specific interval.
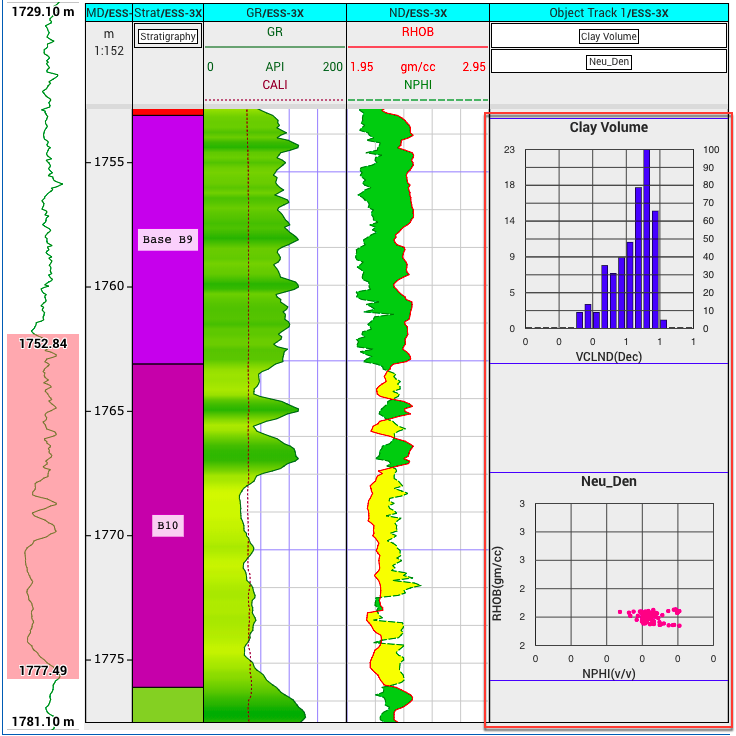
Cross-plot and histogram can be shown alongside log-plot for more thorough data analysis over any depth interval.
https://youtube.com/shorts/wso4g-sLSO4
Common properties (i.e., scale, color, line style …) of track/curve can be quickly updated at once via bulk-update feature.
Log-plot templates can be used to quickly recreate plots for other wells or data sets.
Innovative log plot designer feature allows log-plot templates can be created from multiple existing log plots or log tracks.
Well Insight
Plot View (Crossplot)
Interactive data analysis with multi-well and multi-zone support
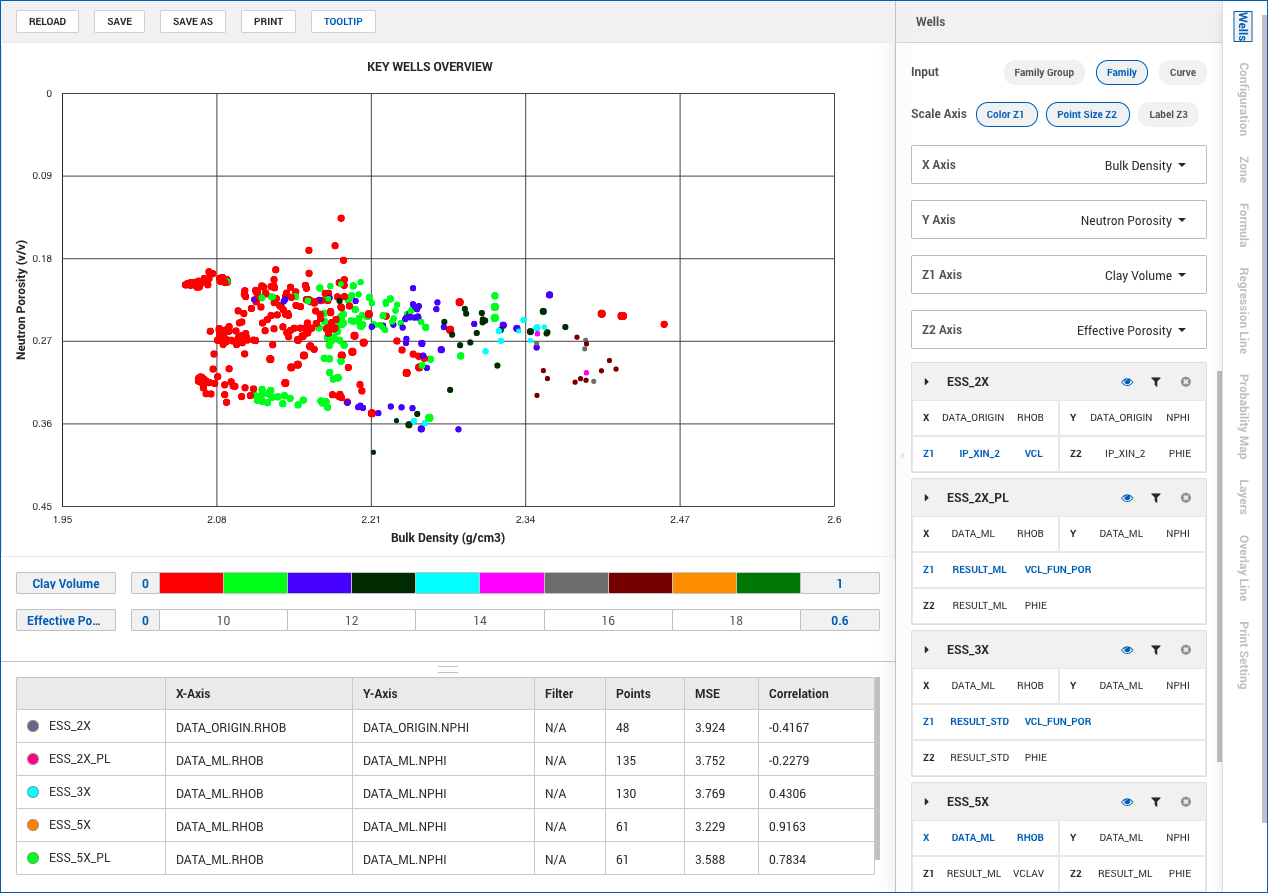
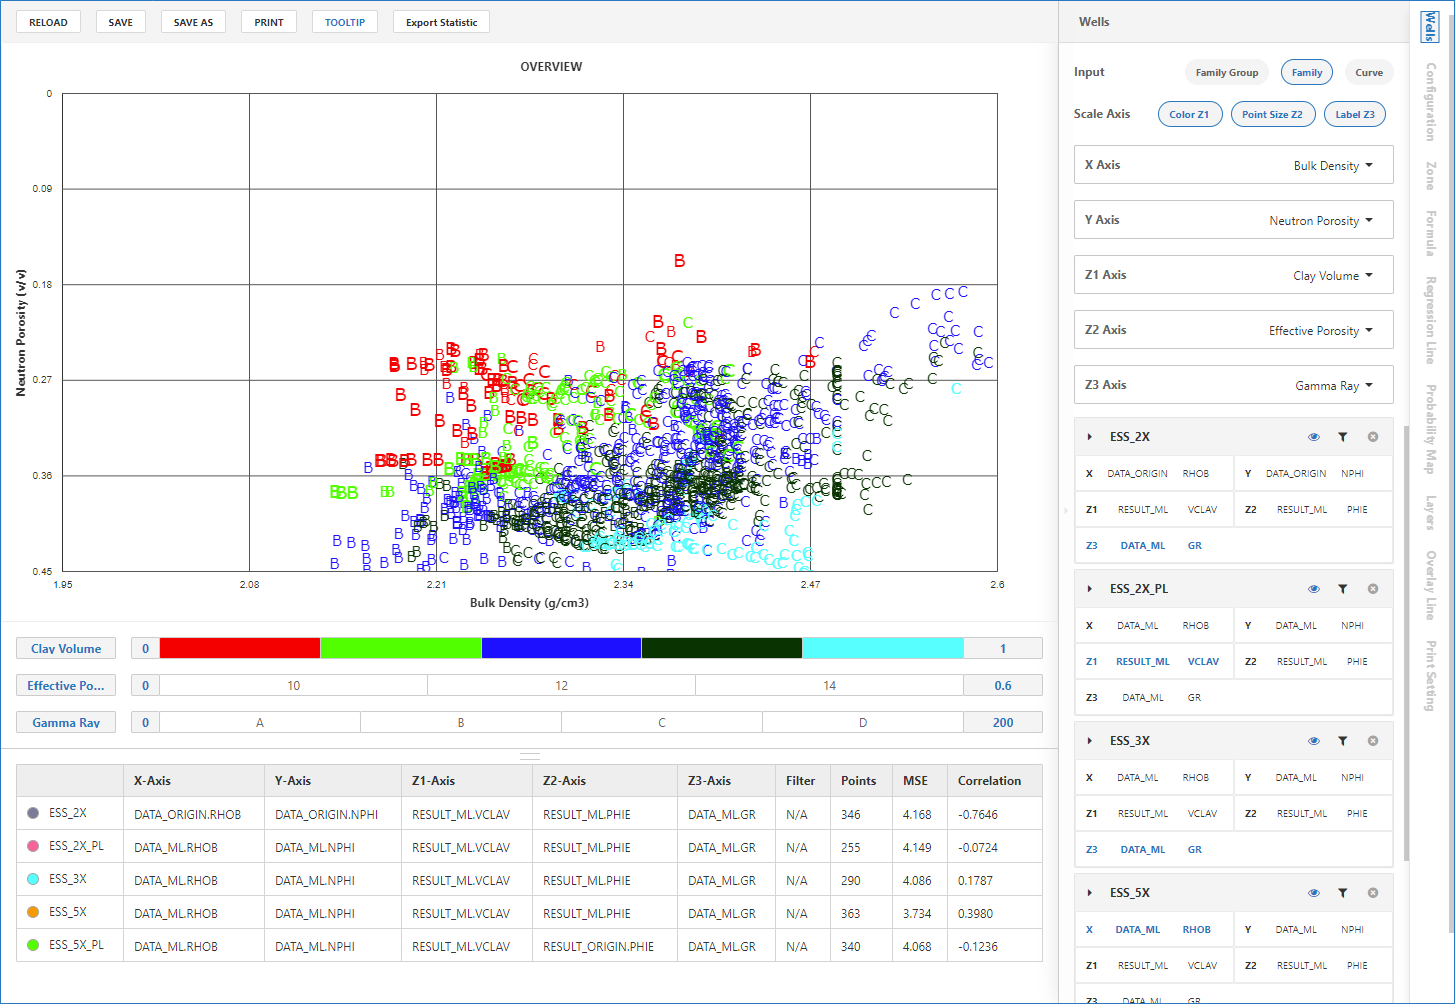
Simply incorporate 5 dimensions (X axis, Y axis, Z1 – Color, Z2 – Point size, and Z3 – Label) in a single window
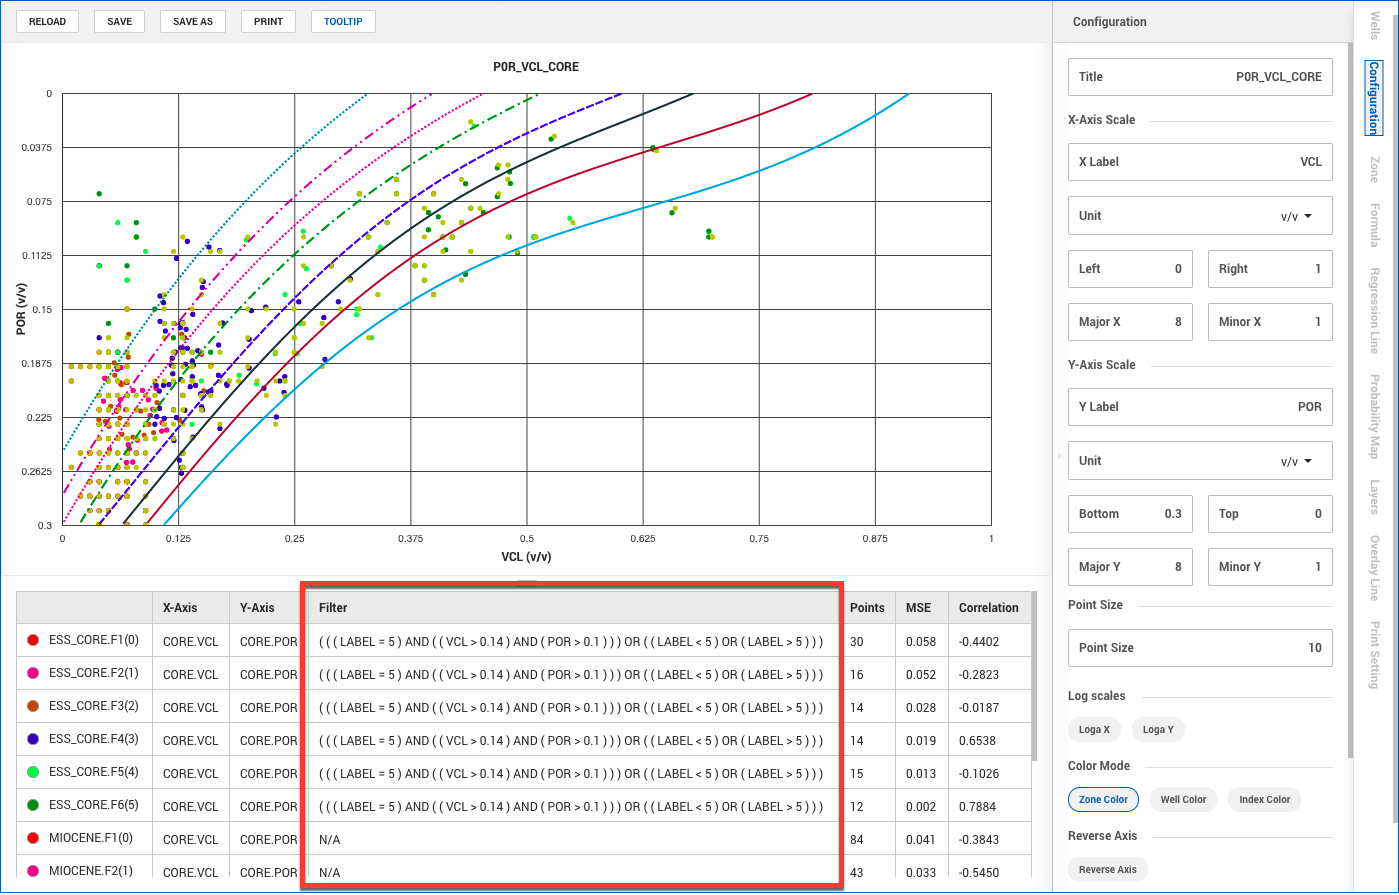
Users can combine multiple filters (e.g. facies, fluid code or any classification group) to display exact data they need.
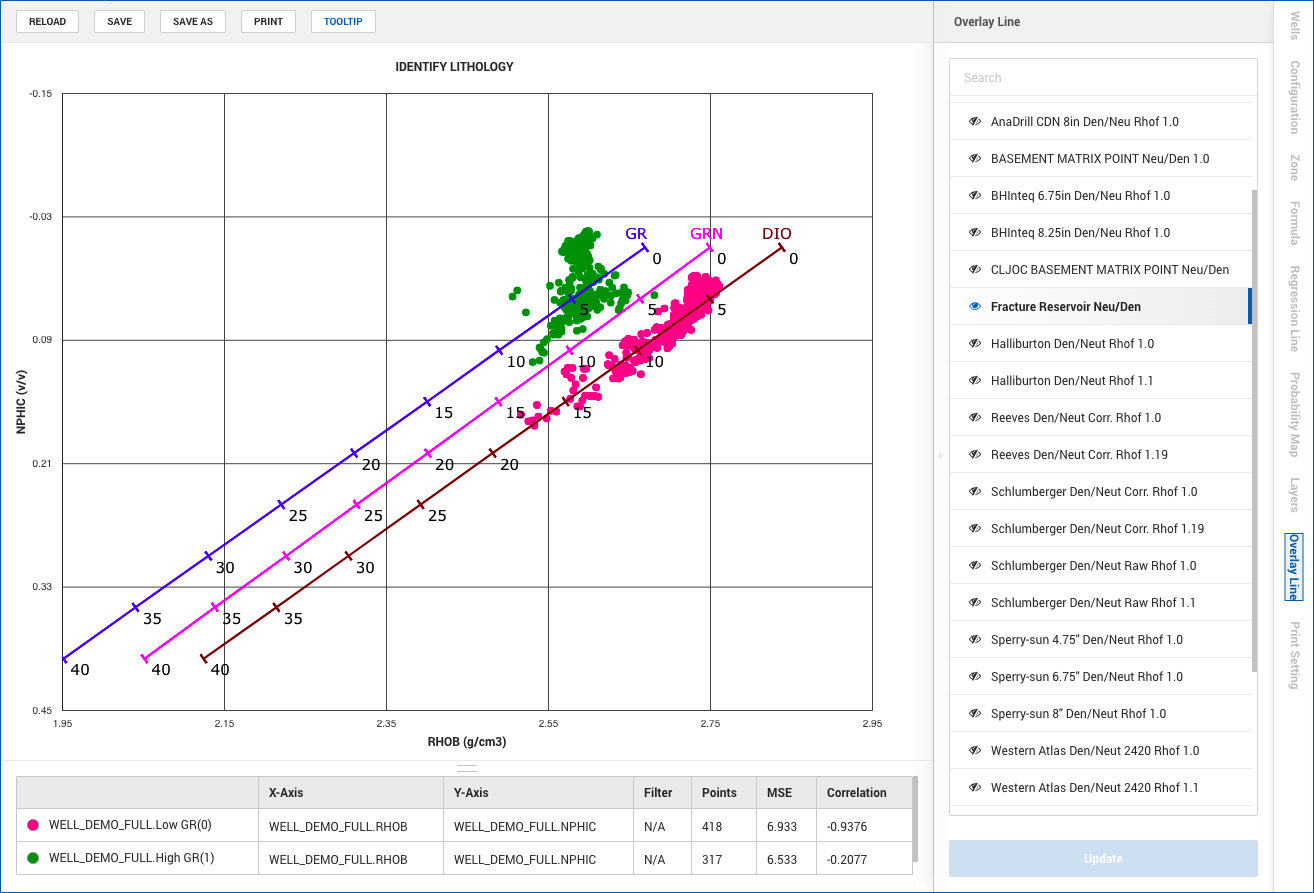
Quickly identify the lithologies by adding various predefined overlay lines
Users can display unlimited custom functions on the plot.
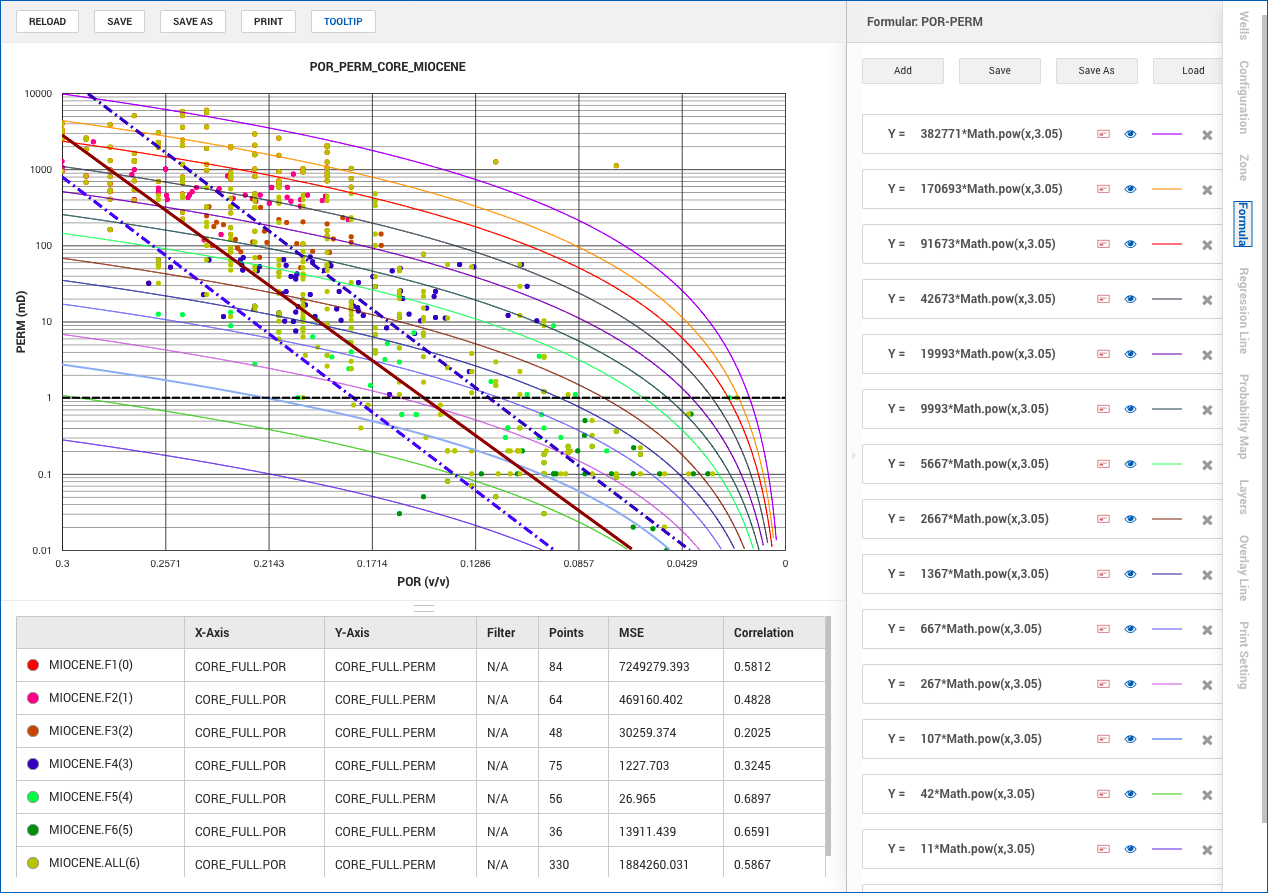
Flexible ways to select data points (i.e. filters, layers or polygons) to create regressions (i.e. linear, exponential, power, polynomial)
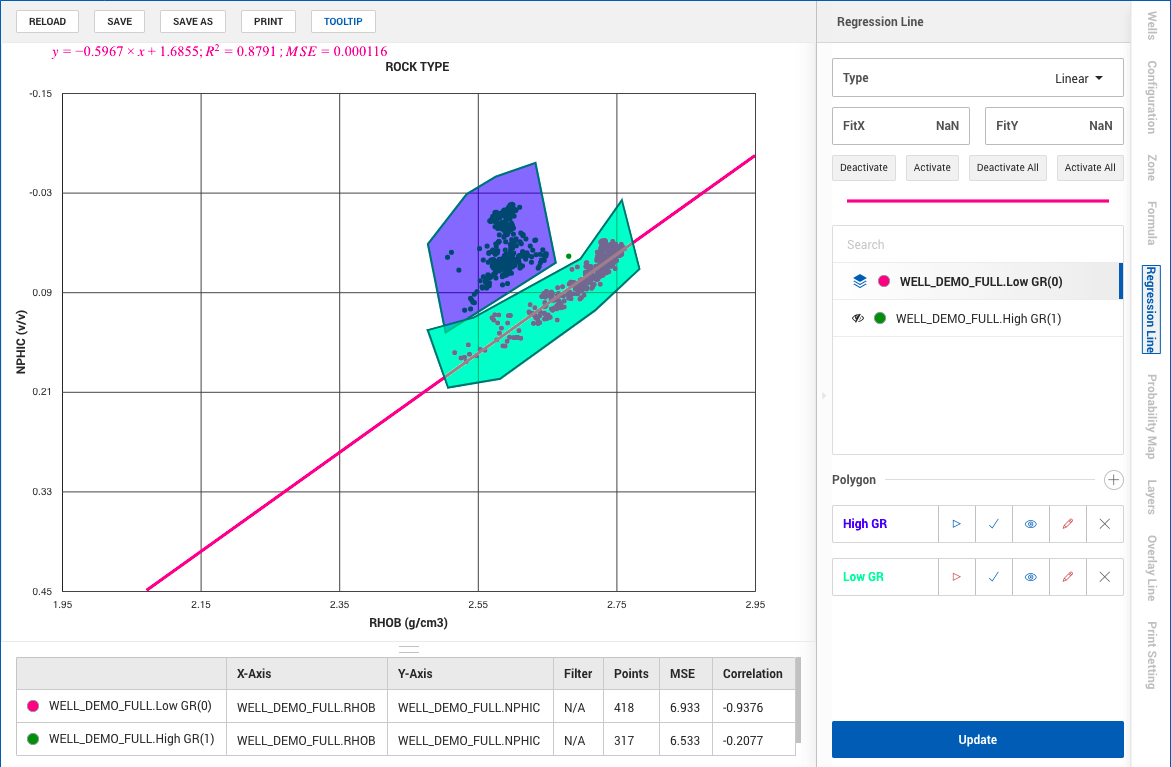
Innovative “layer” concept which let users can easily turn on/off the data layer they need
Well Insight
Plot View (Histogram)
Interactive data analysis with multi-well and multi-zone support.
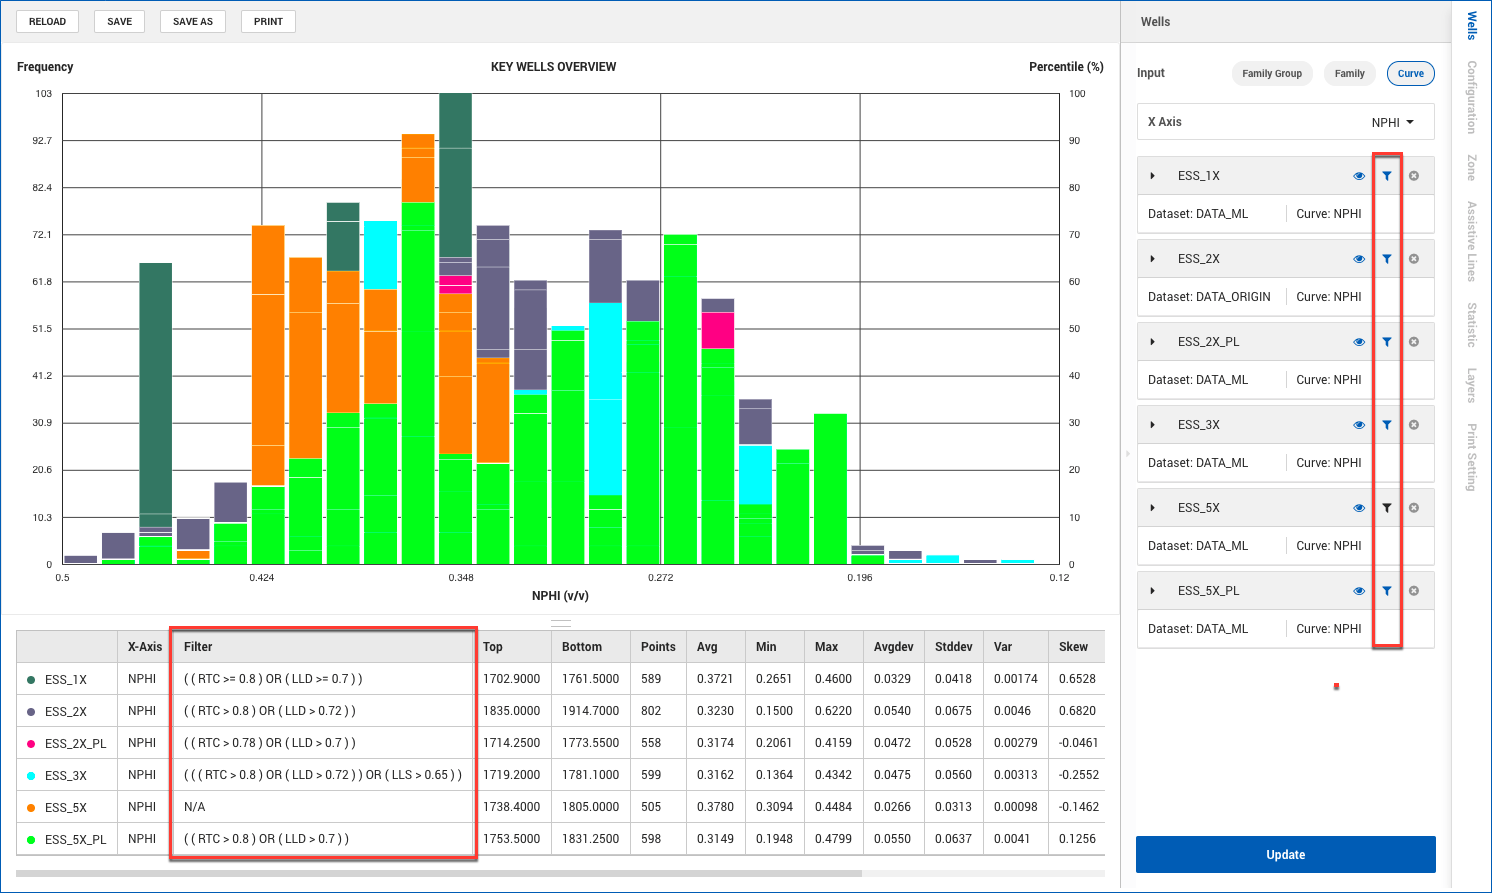
Display more specific data by applying multiple filters at any wells.
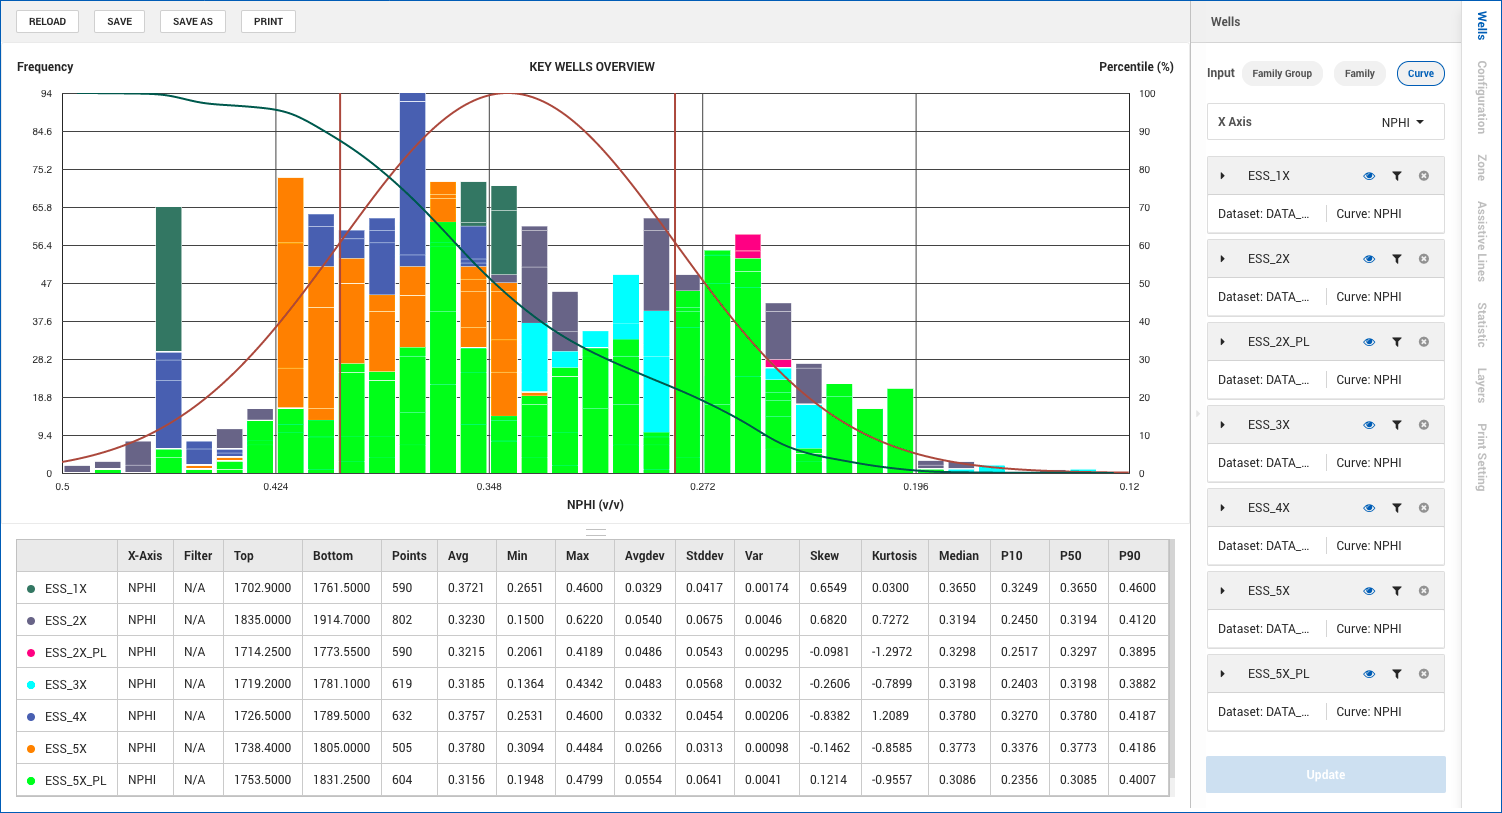
Easily show data statistic at any layers.
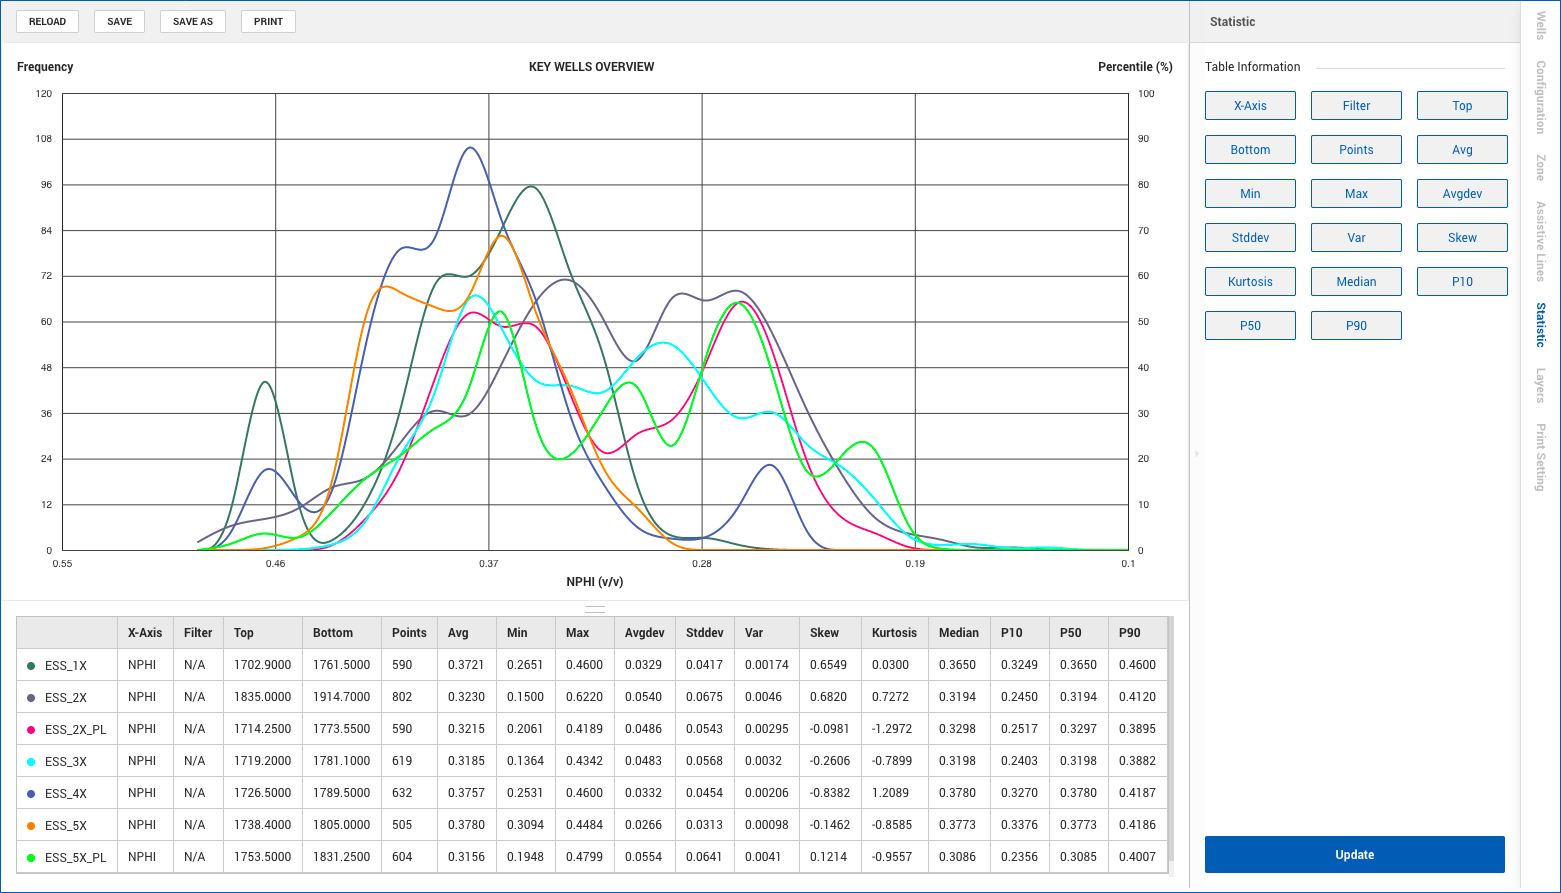
Data can be displayed with 2 chart types (line, bar) and 4 stacked modes (well, zone, all and unstacked).
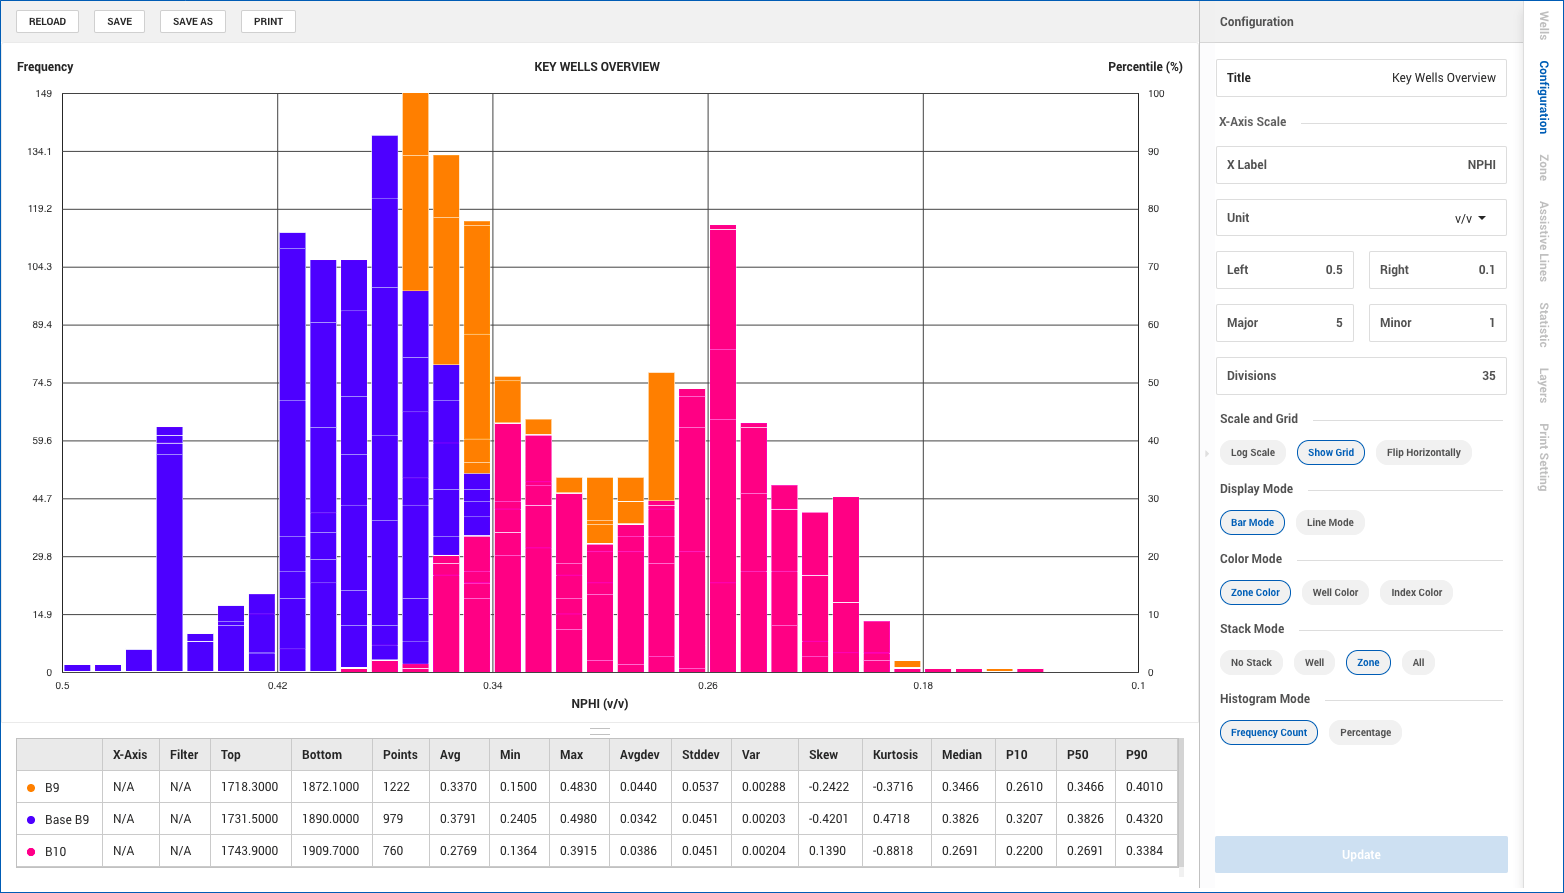
Innovative “layer” concept which let users can easily turn on/off the data layer they need.
Well Insight
Workflow and Task (Interpretation task)
An interpretation task enables users calculating multiple output curves from multiple input curves at the scope of multi-zone, multi-dataset in a well or multi-well.
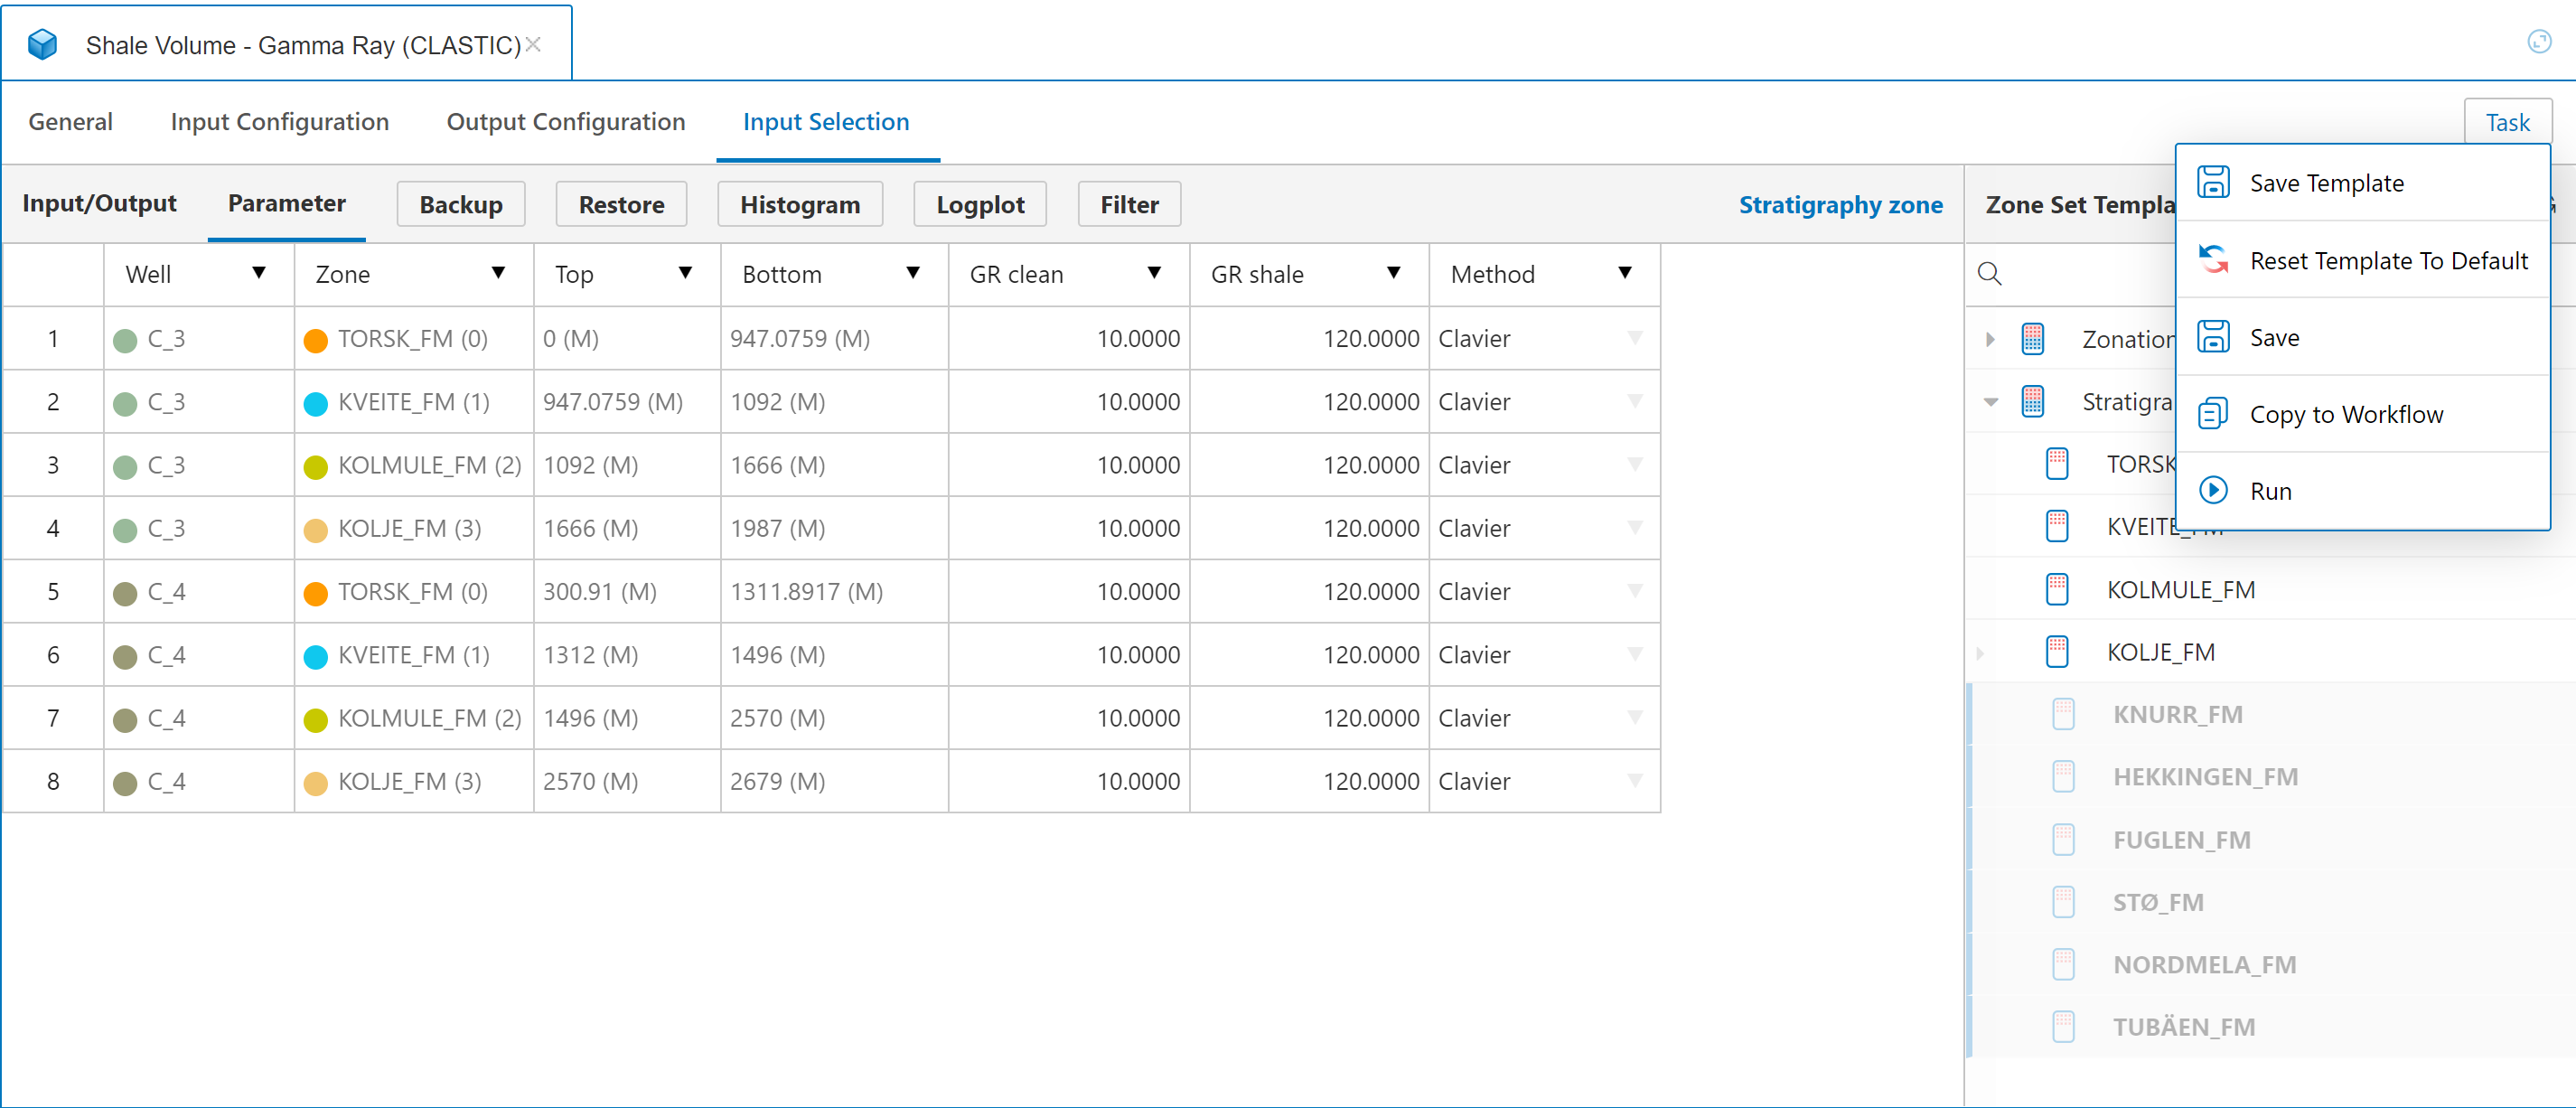
A task can be reused in different interpretation workflows, saving a lot of time to recreate the same task for every workflow.
Users can store frequently used parameters and quickly re-apply them at other tasks or workflows at the zone, well, or project level.
During the interpretation process, multiple versions of zone can be saved and restored later to help users quickly compare and choose the best result.
Well Insight
Workflow and Task (Interpretation workflow)
With the ability to visually connect, disconnect, rearrange, disable, enable various tasks, users can save a significant amount of time when customizing their multi-well interpretation workflows.
Users can quickly apply a zone set or wells to all tasks in the workflow at the same time.
Users can save frequently used workflows as templates for later use, saving a significant of time to recreate similar workflows from the scratch.
Well Insight
Petrophysics package CRP (Clastic Reservoir Petrophysics)
A complete interpretation workflow from shale volume, porosity, water saturation and summaries for multi-well and multi-zone.
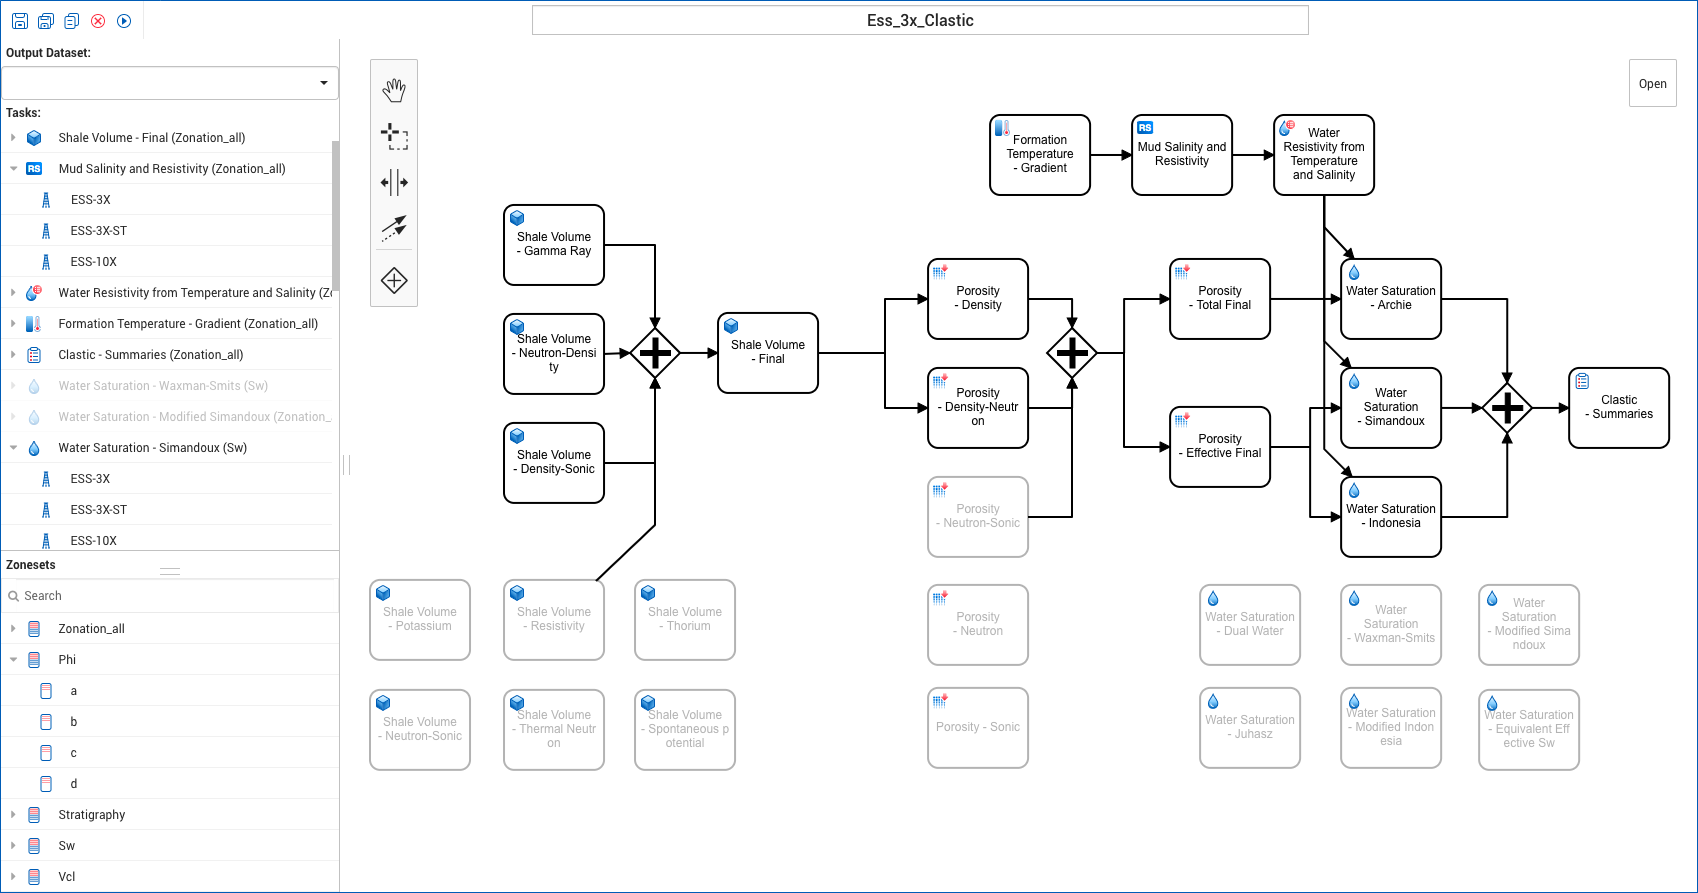
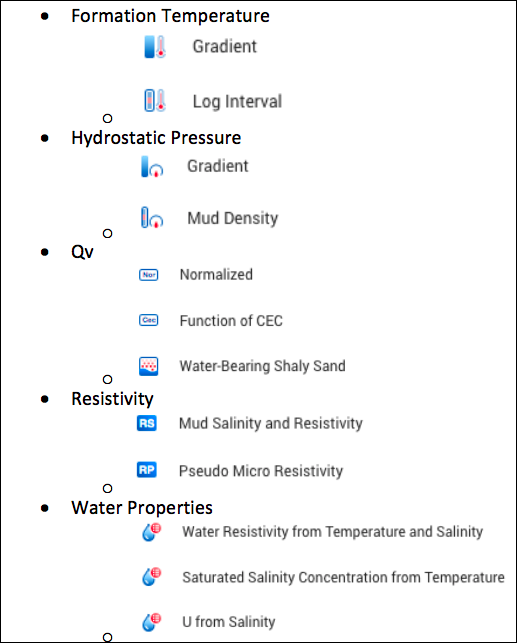
Support various methods for pre-computations.
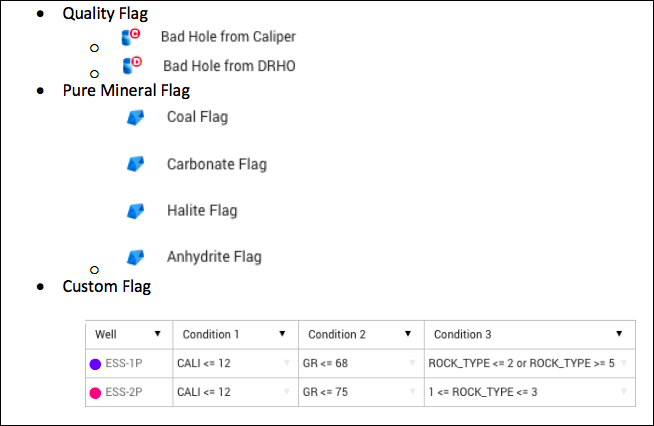
Beside multiple predefined flag creation methods, users can create quality custom flags using any curves to determine the bad hole intervals.
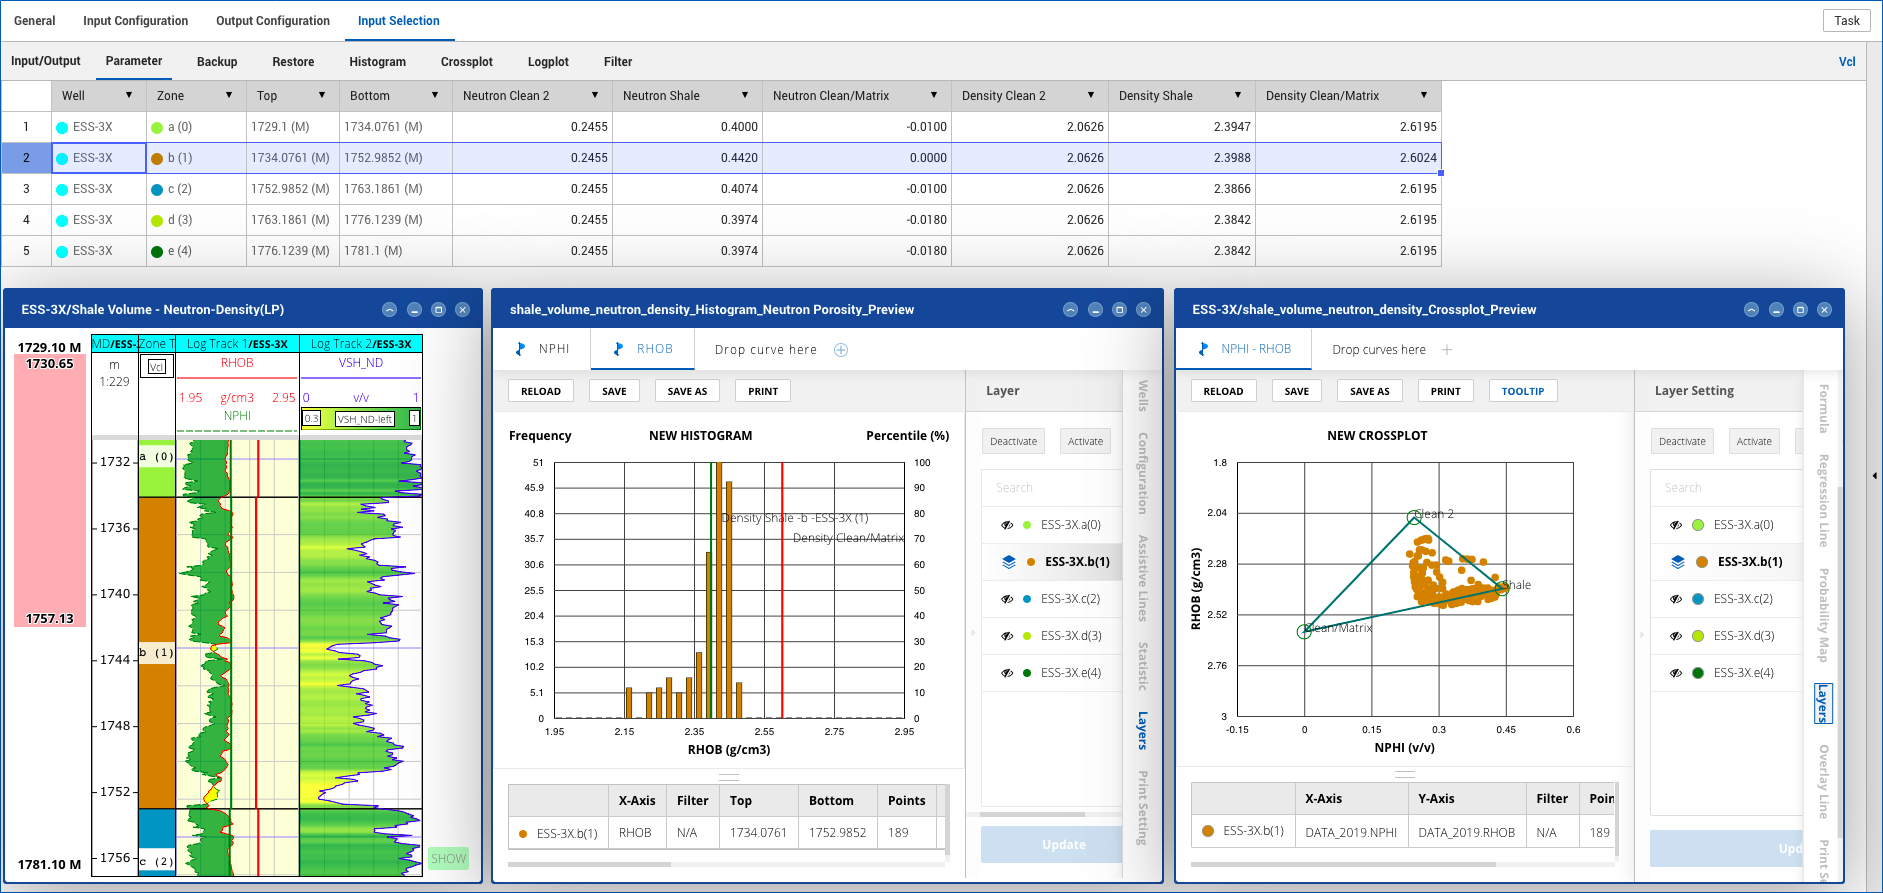
Parameters are synced between task, log-plot, cross-plot and histogram making it easily to fine-tune their values.
Ability to save and re-apply parameters to other tasks or workflows to quickly calculate data at similar conditions.
Simply customize your own workflow (i.e. connect, disconnect, rearrange, activate or deactivate any tasks) to control the final result.
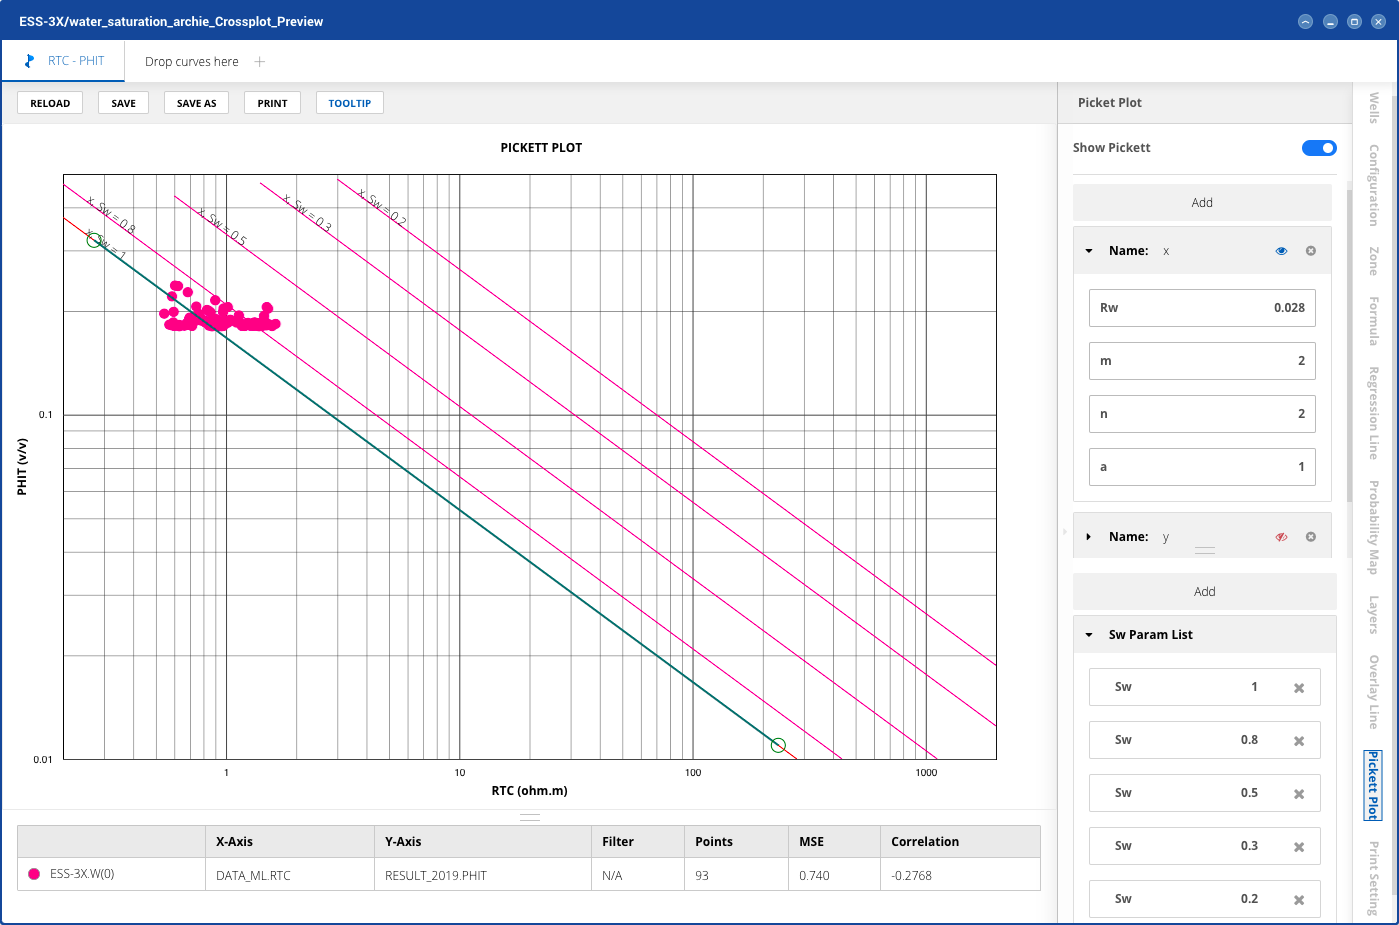
Quickly estimate Sw ranges within a reservoir using a powerful graphic technique Pickett plot.
Well Insight
Petrophysics package FRP (Fractured Reservoir Petrophysics)
Specialized algorithm for log interpretation of fractured massive reservoirs.
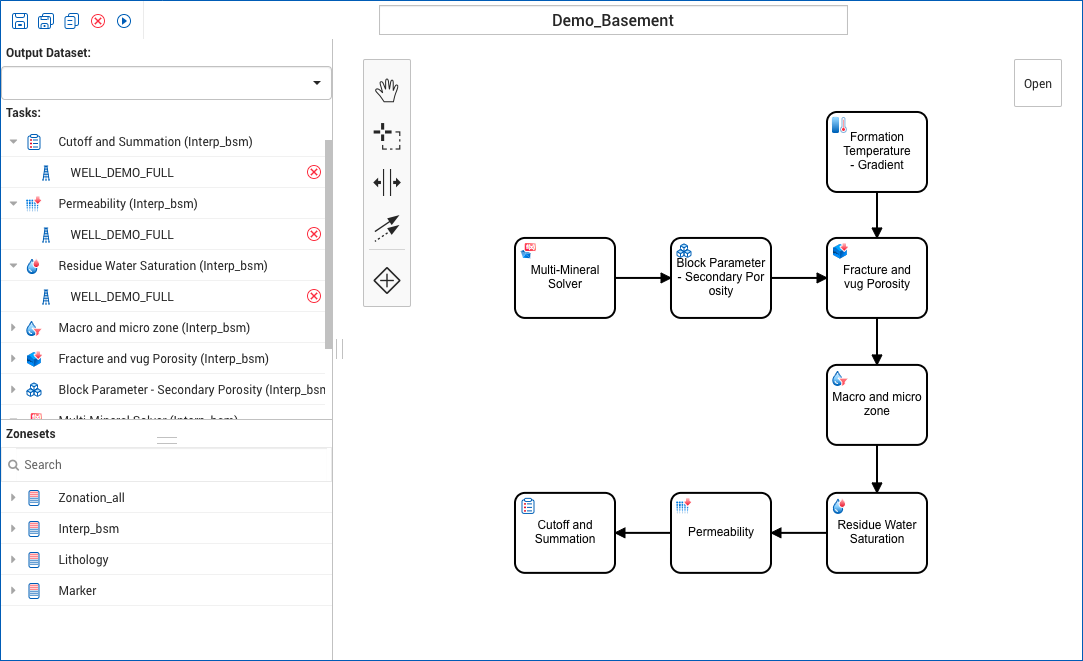
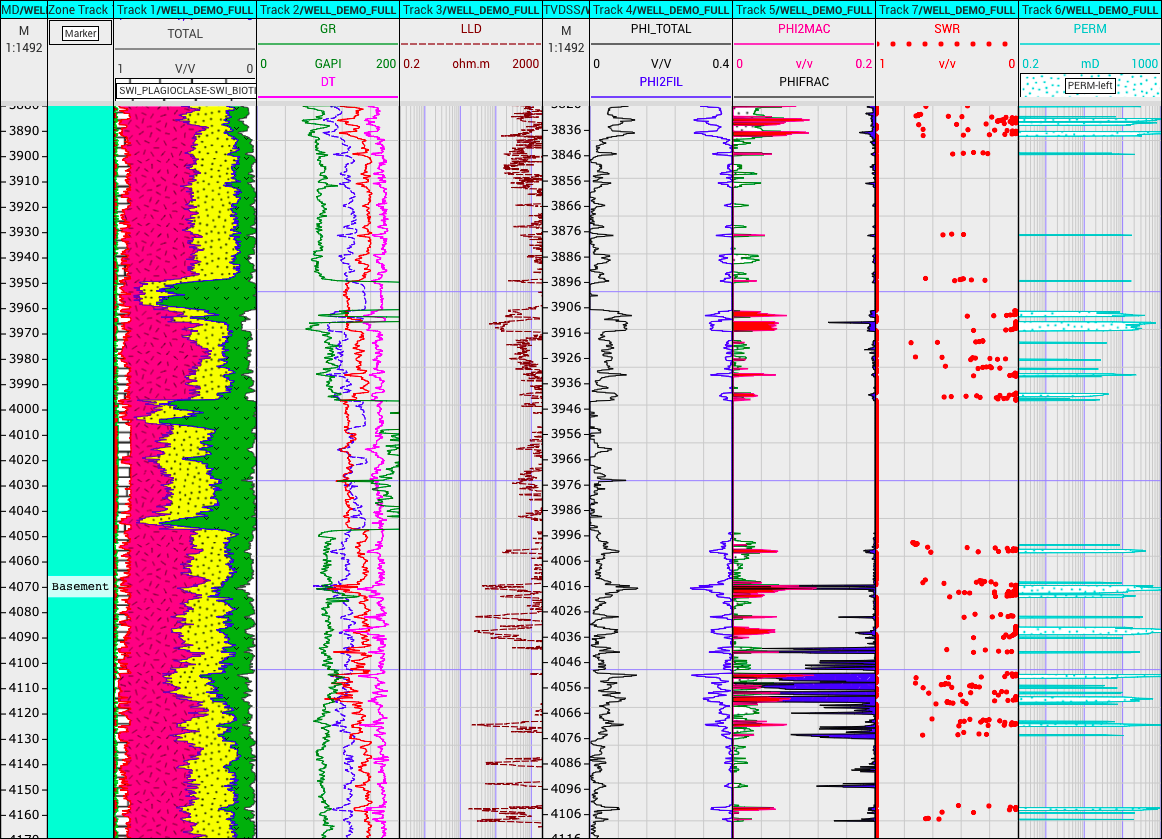
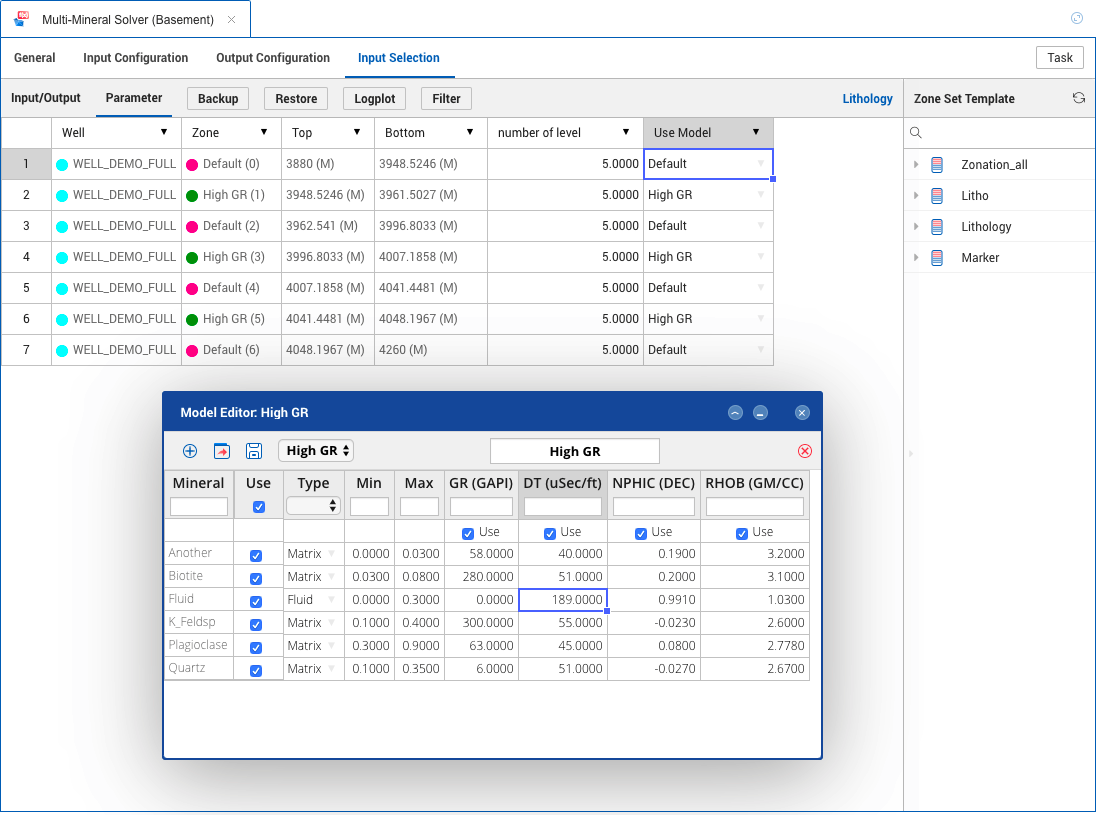
Easily determine the matrix parameter of each mineral from logs and petrography data (volumetric proportion of each mineral of rock) .
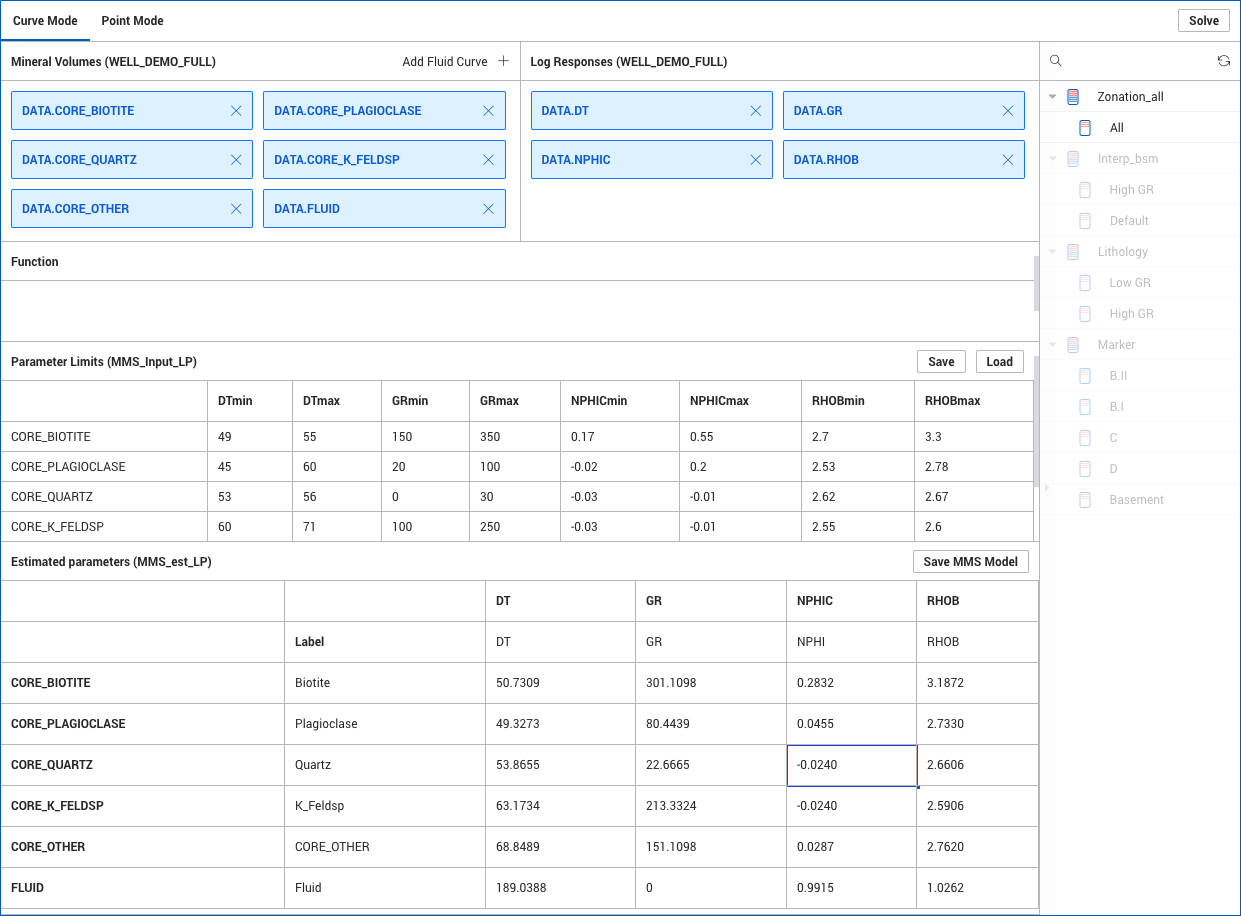
The robust multi-mineral solver allows user to minimize the influence of mineral compositions on total porosity estimation.
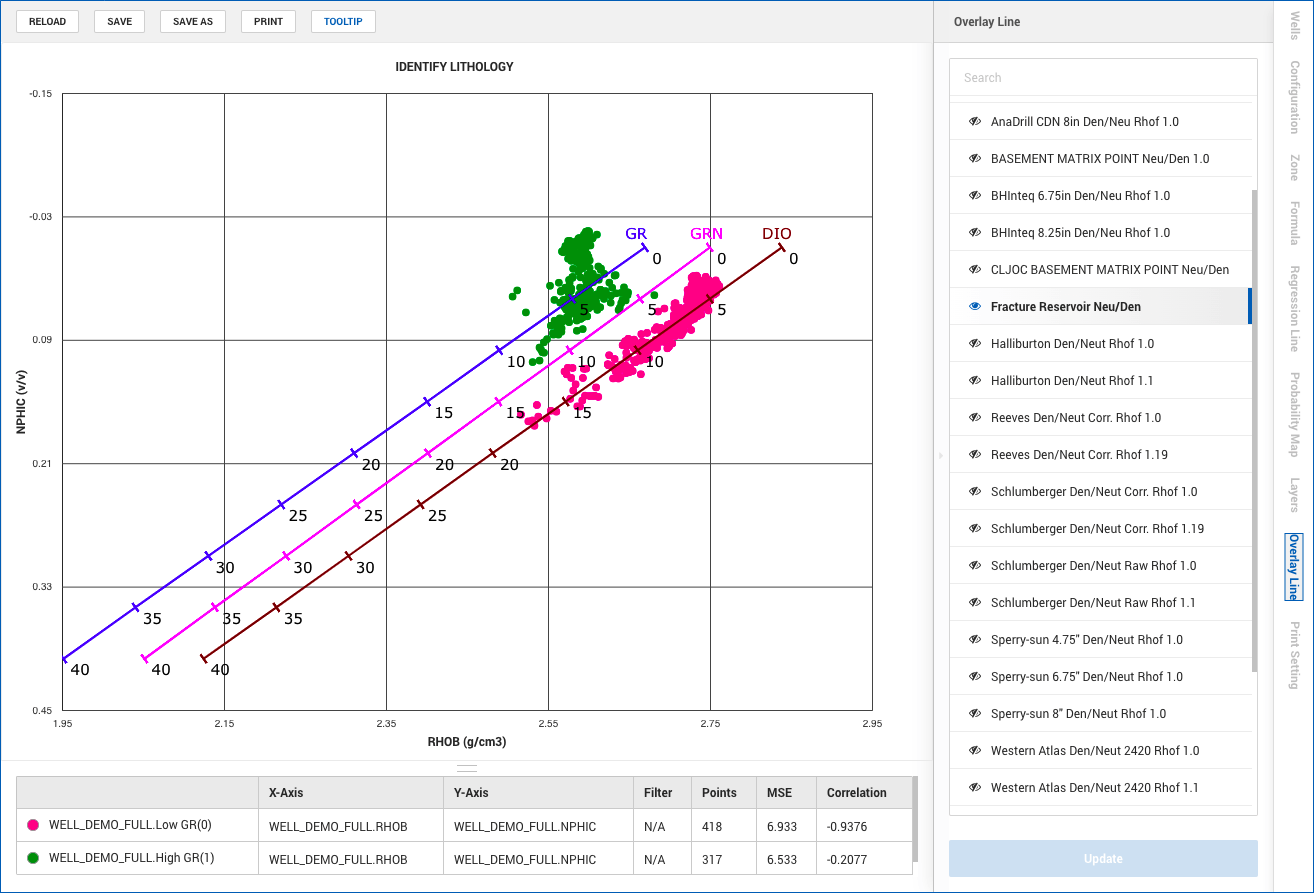
Quickly classify 3 main rock types (i.e. granite, granodiorite and diorite) using the unique overlay lines that are built on core data from hundreds of well in granitoid basement.
Well Insight
Reservoir package (FPA)
User can easily determine fluid contacts (OWC, GOC or GWC) by analysing their single and multi-well data with an intuitive interface.
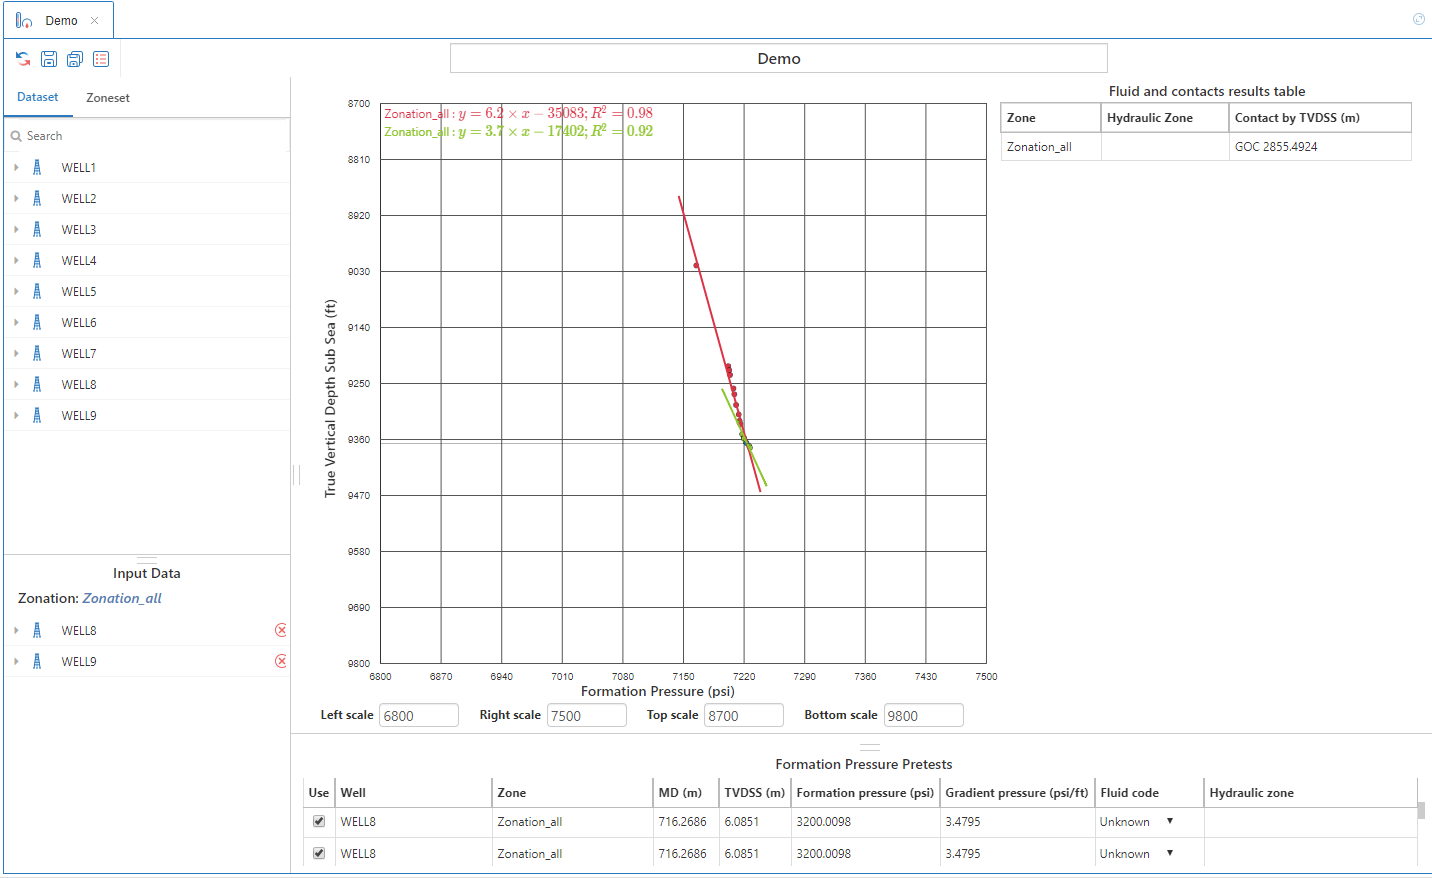
Interactively adjust pressure gradients ranges to estimate fluid contacts.
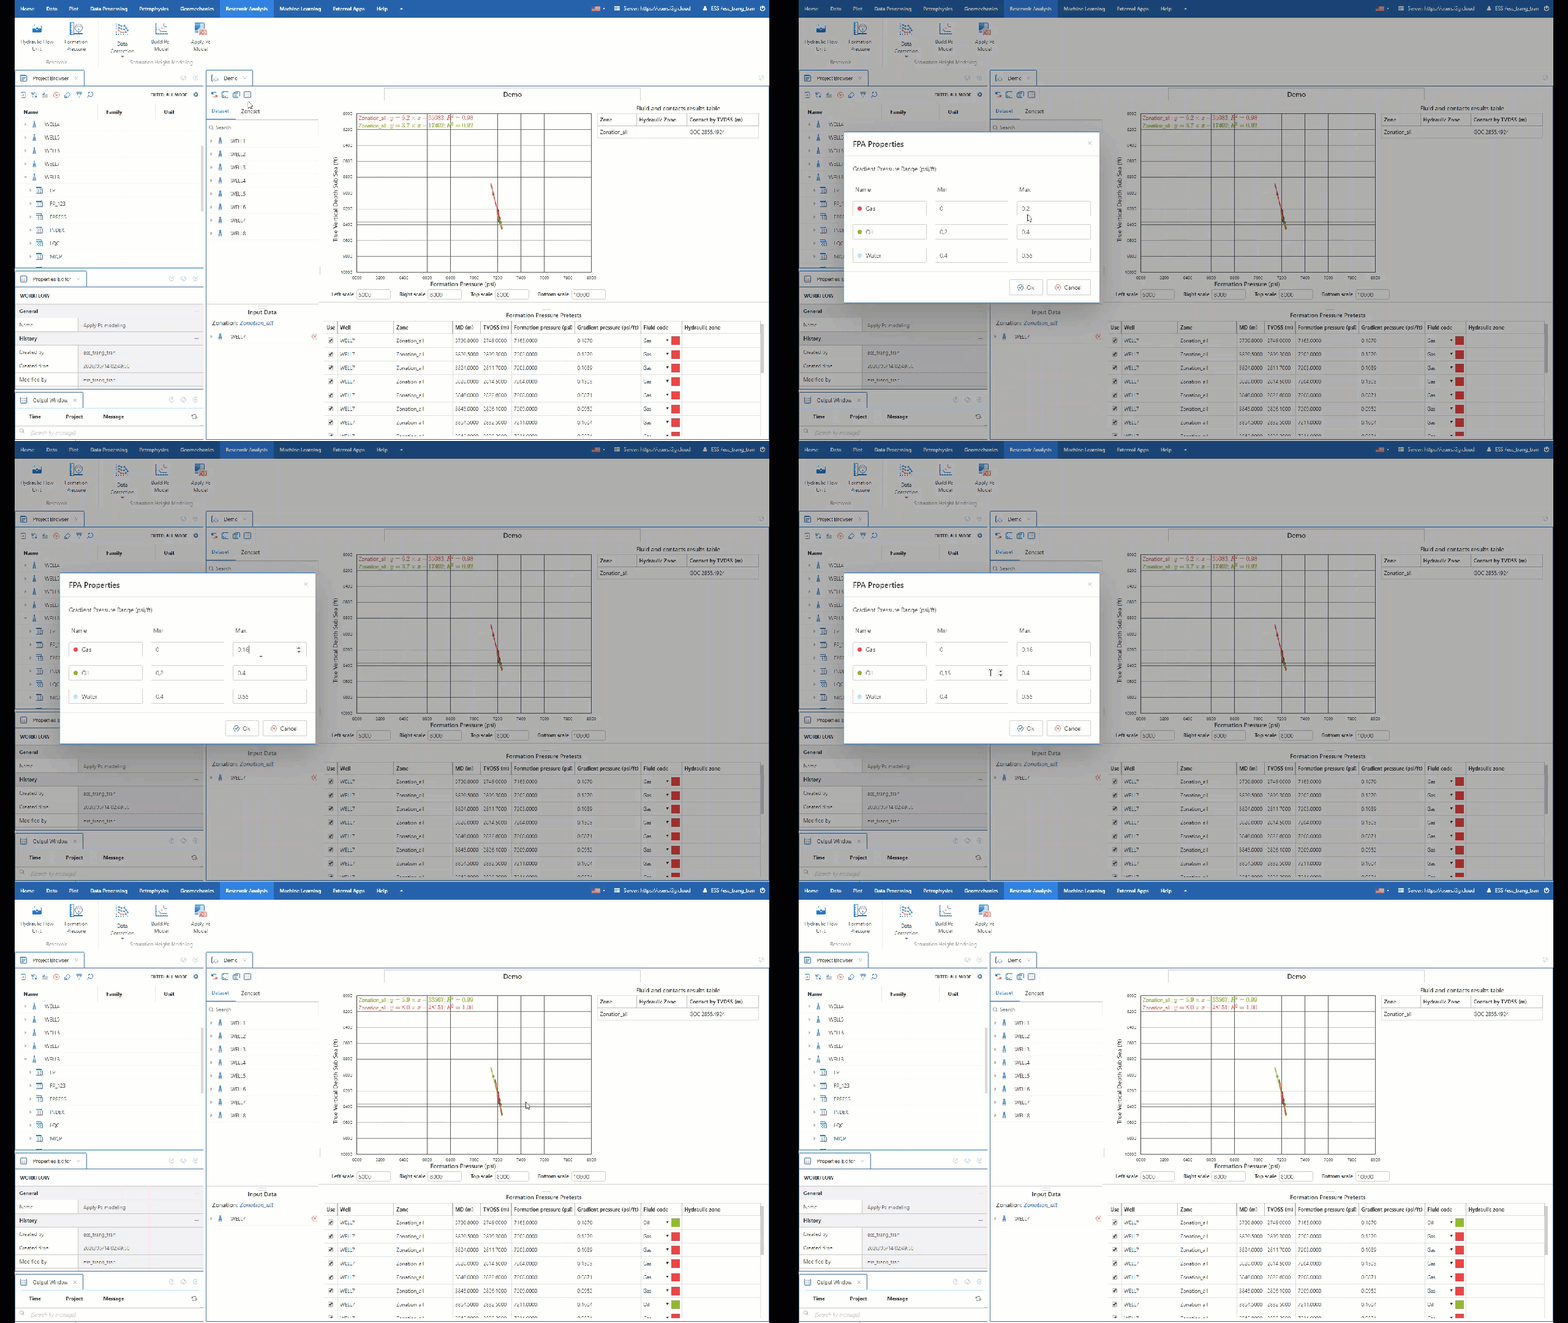
User can manually adjust fluid code and/or hydraulic zone for each pressure point via an intuitive data table.
Well Insight
Reservoir package (HFU)
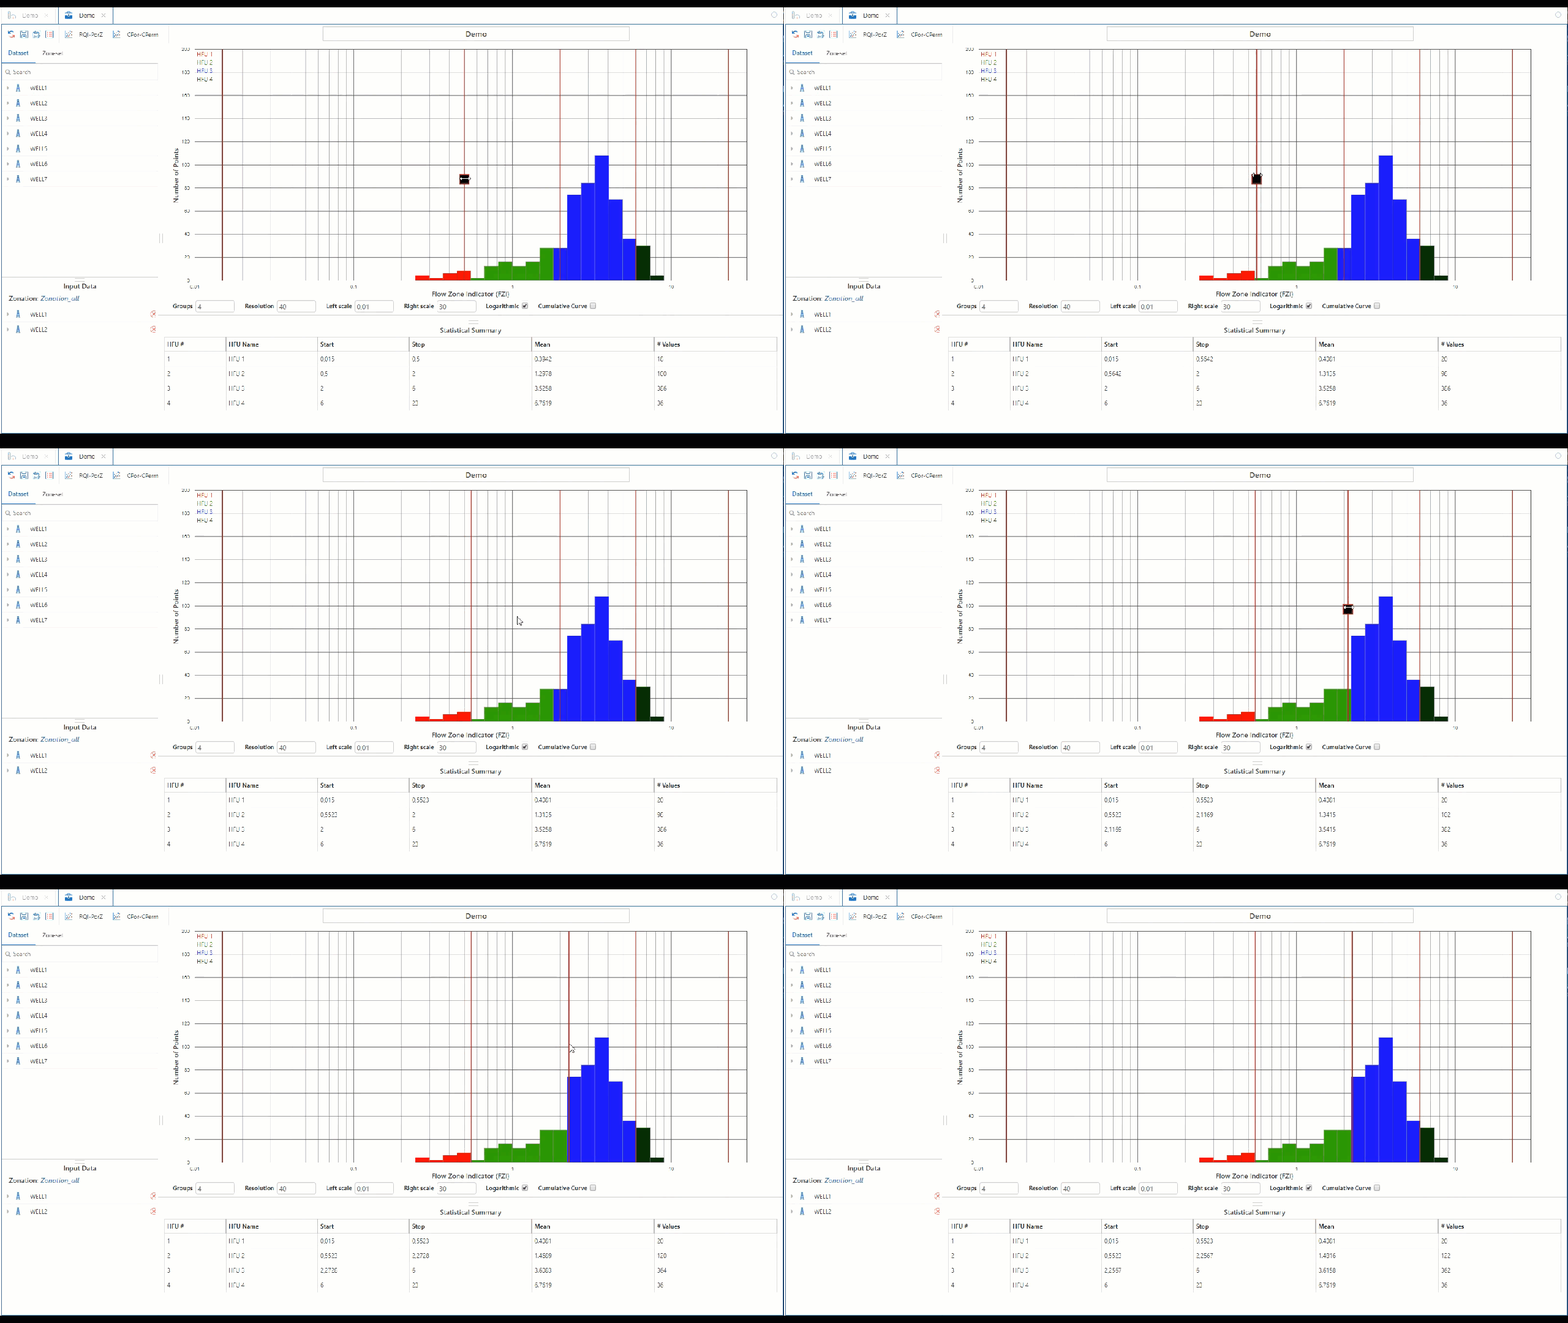
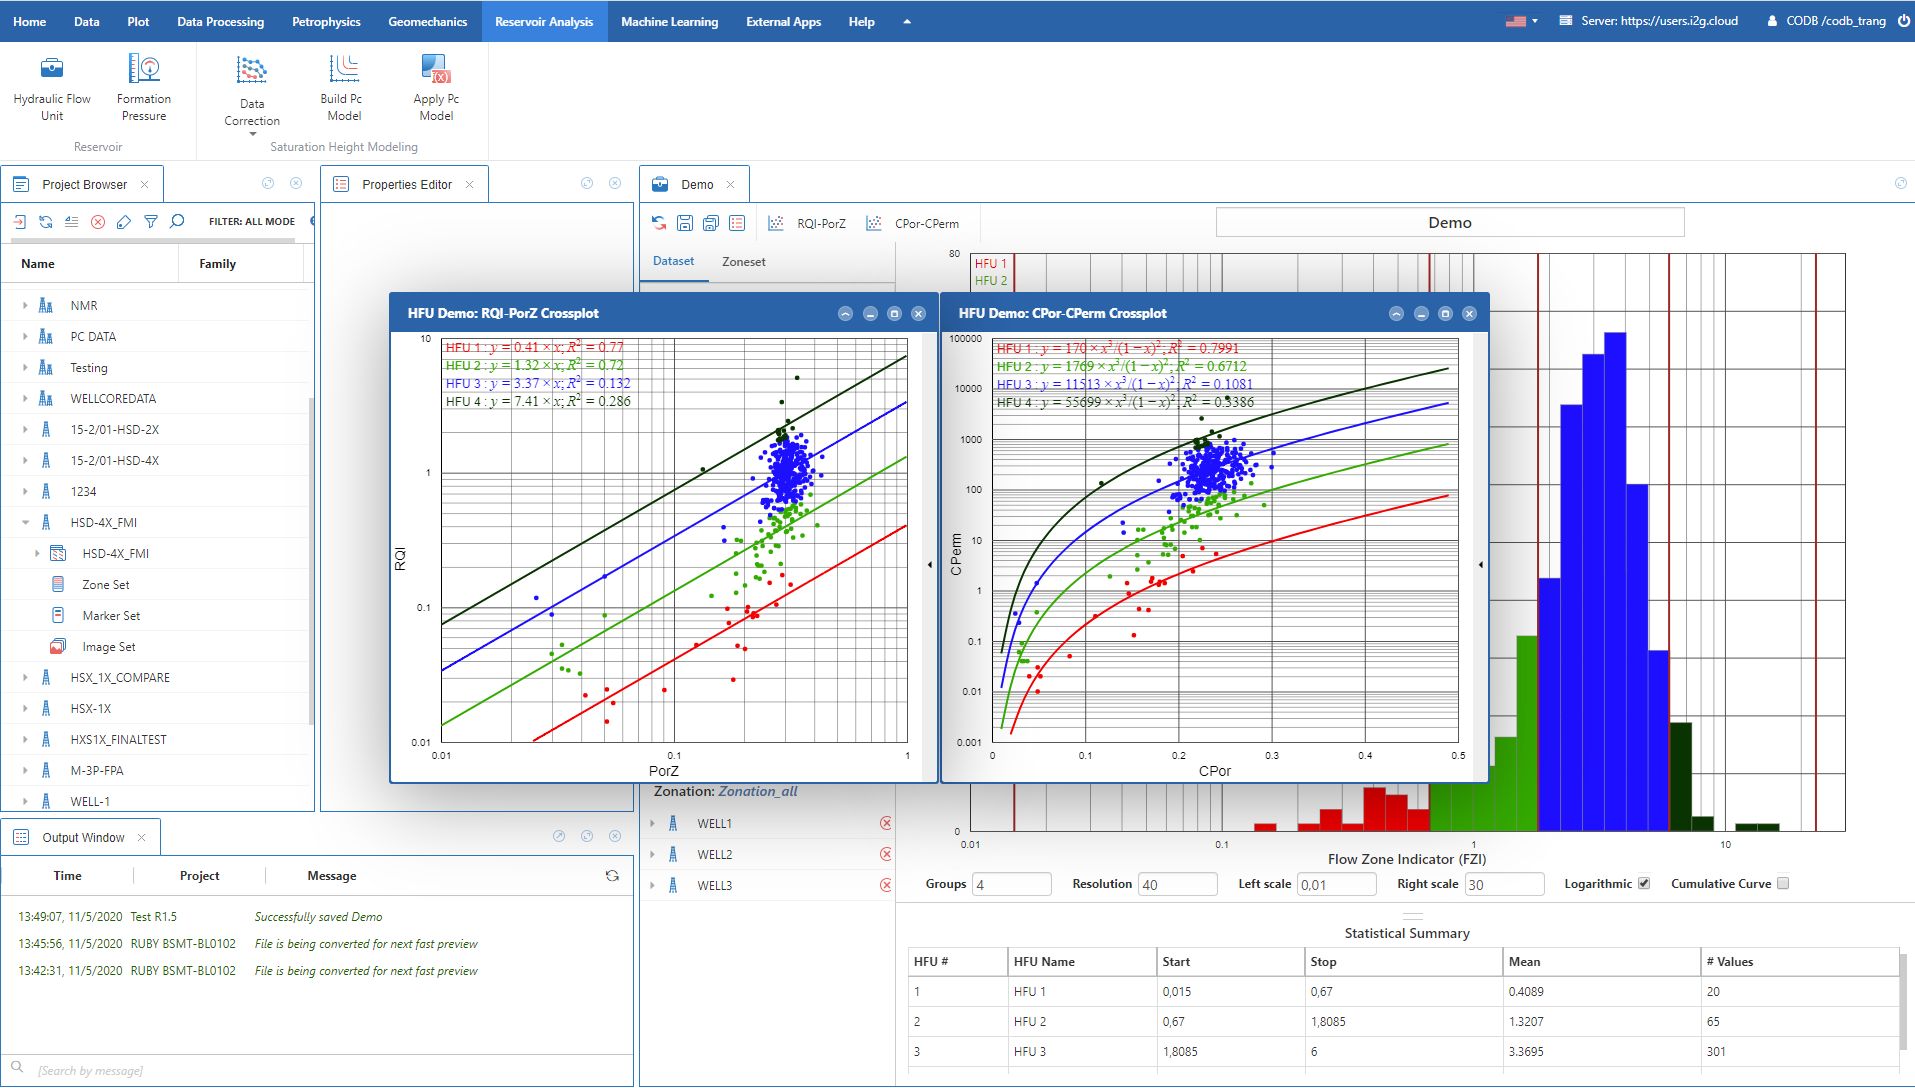
Users can classify core data in hydraulic flow units (HFU) in single or multi-well mode.
A graphical interface allows users easily analyze and intuitively adjust HFU result in order to get desired results.
The workflow supports two cross-plots (i.e., RQI-PorZ and Cpor-Cperm relationship for each HFU) for quality control purpose.
Well Insight
Reservoir package (SHM)
Users can QC and make corrections for overburden stress, clay-bound water and the difference between laboratory and reservoir conditions.

Users can classify data into different groups and automatically generate saturation height function for each group with 3 types: J Function, J Modified Function and Corey Brooks.
Quickly transfer parameters from “Build Pc model” step to “Apply Pc model” step to calculate water saturation.
Well Insight
Project database
Project data (well, datasets, plots …) and their related flat files (excel sheet, doc, pdf, images…) are stored in a unified online platform and can be linked together allowing users quickly find related items (i.e., find plots belong to a certain report …).
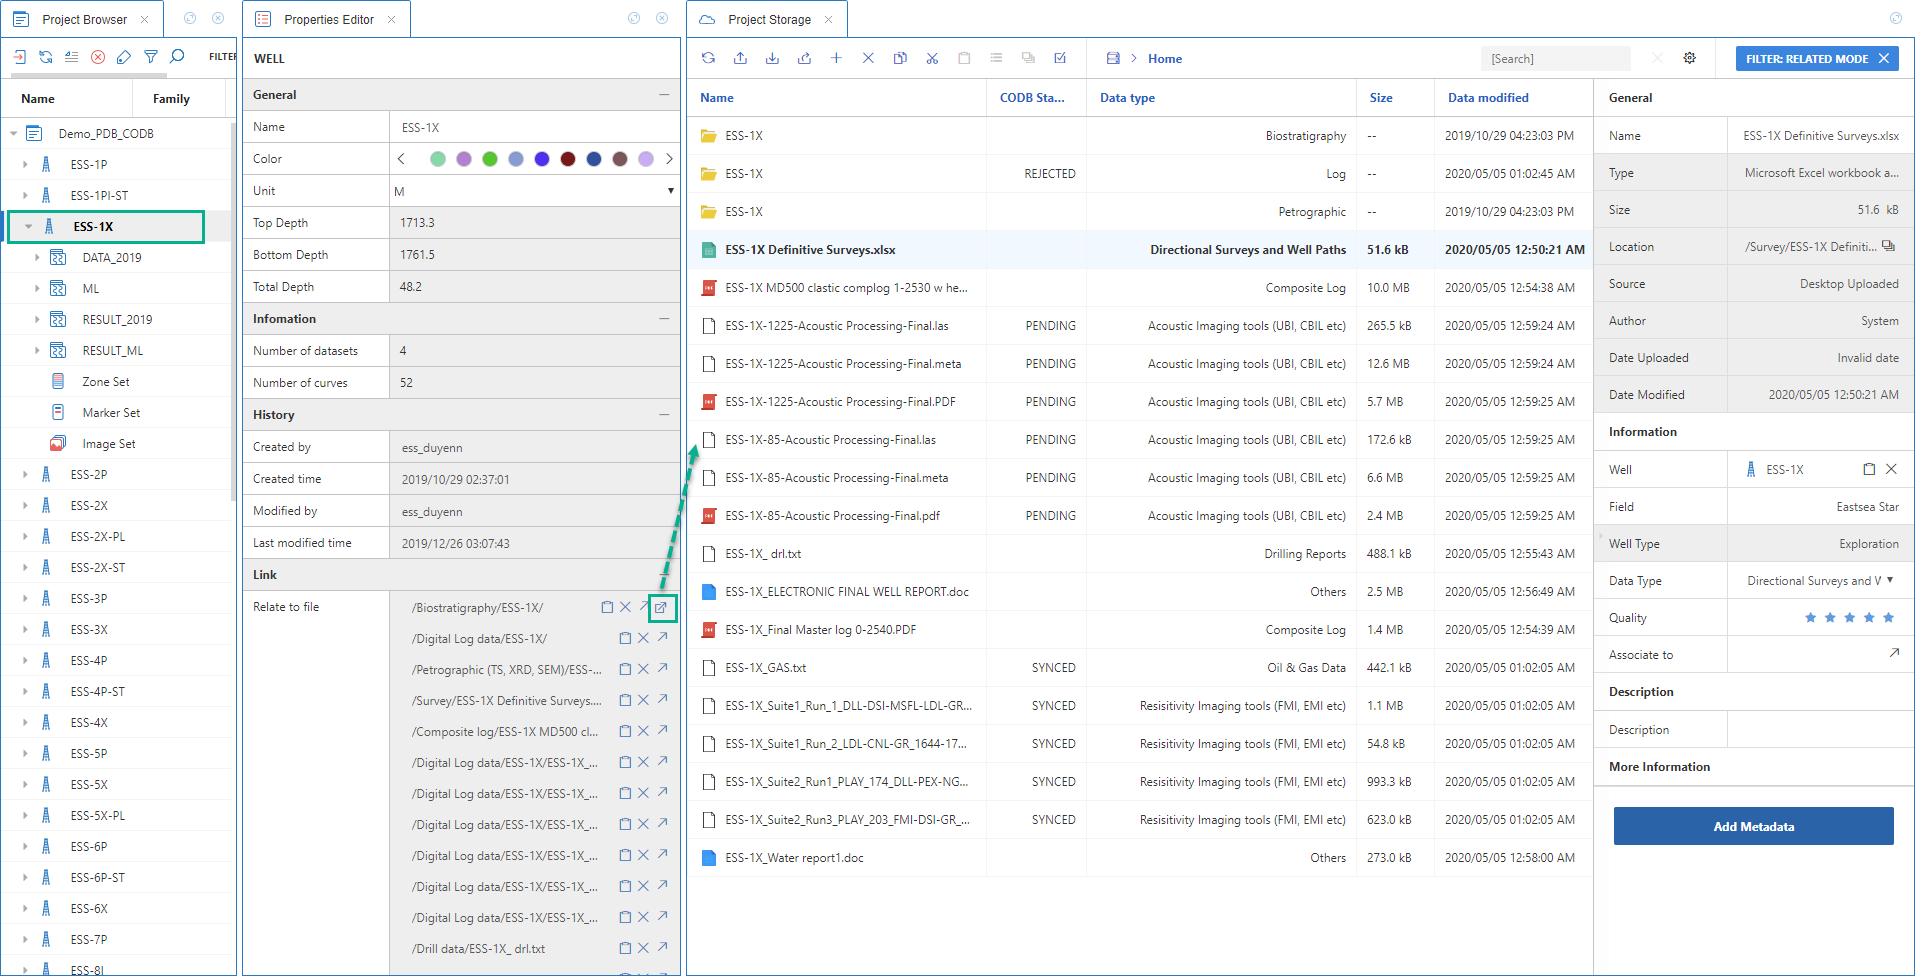
A comprehensive metadata system allows users searching data very quickly and precisely.

Users can quickly preview files (i.e .las, .csv, .doc, .png, .pdf, .pptx, etc.) in the project storage.

Data from project database can be synced to corporate database for central data management purpose. The admin can approve or reject sync requests to keep corporate database organized.
